Galaxy And Mass Assembly (GAMA): The Life and Times of L* Galaxies PDF
Preview Galaxy And Mass Assembly (GAMA): The Life and Times of L* Galaxies
Mon.Not.R.Astron.Soc.000,1–30(2013) Printed31January2013 (MNLATEXstylefilev2.2) Galaxy And Mass Assembly (GAMA): The Life and Times L∗ of Galaxies 3 1 A.S.G. Robotham1,2⋆, J. Liske3, S.P. Driver1,2, A.E. Sansom4, I.K. Baldry5, 0 A.E. Bauer6, J. Bland-Hawthorn7, S. Brough6, M.J.I. Brown8, M. Colless6, 2 L. Christodoulou9, M.J. Drinkwater10, M.W. Grootes11, A.M. Hopkins6, L.S. Kelvin,1,2,12, n a P. Norberg13, J. Loveday9, S. Phillipps14, R. Sharp15, E.N. Taylor,7,16, R.J. Tuffs,11 J 0 1SUPA†, School of Physics& Astronomy, Universityof St Andrews, North Haugh, St Andrews, KY16 9SS, UK 3 2ICRAR‡, The Universityof WesternAustralia, 35 Stirling Highway, Crawley, WA 6009, Australia 3European Southern Observatory, Karl-Schwarzschild-Str. 2, 85748 Garching, Germany ] O 4Jeremiah Horrocks Institute, Universityof Central Lancashire, Preston PR1 2HE, UK 5Astrophysics Research Institute, Liverpool John Moores University,Egerton Wharf, Birkenhead, CH41 1LD, UK C 6Australian Astronomical Observatory, PO Box 296, Epping, NSW 1710, Australia h. 7Sydney Institute for Astronomy, School of Physics, University of Sydney, NSW 2006, Australia p 8School of Physics, Monash University,Clayton, Victoria3800, Australia - 9Astronomy Centre, Universityof Sussex, Falmer, Brighton BN1 9QH, UK o 10Department of Physics, The Universityof Queensland, Brisbane, QLD 4072, Australia r 11Max Planck Institute for Nuclear Physics(MPIK), Saupfercheckweg 1, 69117 Heidelberg, Germany st 12Institut fu¨rAstro- und Teilchenphysik, UniversittInnsbruck, Technikerstrae 25, 6020 Innsbruck, Austria a 13Institute forComputational Cosmology, Department of Physics, Durham University,South Road, Durham DH1 3LE, UK [ 14HH Wills PhysicsLaboratory, University of Bristol, Tyndall Avenue, Bristol, BS8 1TL, UK 15Research School of Astronomy & Astrophysics, The Australian National University,CotterRoad, Weston Creek, ACT 2611, Australia 1 16School of Physics, the Universityof Melbourne, Parkville, VIC 3010, Australia v 9 07/01/2013 ABSTRACT 2 1 In this work we investigate in detail the effects local environment (groups and 7 pairs) has on galaxies with stellar mass similar to the Milky-Way (L∗ galaxies). A . 1 volume limited sample of 6,150 galaxies is visually classified to determine emission 0 features, morphological type and presence of a disk. This large sample allows for the 3 significant characteristics of galaxies to be isolated (e.g. stellar mass and group halo 1 mass), and their codependencies determined. v: We observethat galaxy-galaxyinteractionsplaythe mostimportantrole inshap- i ing the evolution within a group halo, the main role of halo mass is in gathering the X galaxies together to encourage such interactions. Dominant pair galaxies find their r overallstar formation enhanced when the pair’s mass ratio is close to 1, otherwise we a observe the same galaxies as we would in an unpaired system. The minor galaxy in a pair is greatly affected by its companion galaxy, and whilst the star forming fraction is always suppressed relative to equivalent stellar mass unpaired galaxies, it becomes lower still when the mass ratio of a pair system increases. We find that, in general,the close galaxy-galaxyinteractionrate drops as a func- tionofhalomassforagivenamountofstellarmass.Wefindevidenceofalocalpeakof interactionsfor Milky-WaystellarmassgalaxiesinMilky-Wayhalomassgroups.Low mass halos,and in particular Local Group mass halos,are an important environment for understanding the typical evolutionary path of a unit of stellar mass. Wefindcompellingevidenceforgalaxyconformityinbothgroupsandpairs,where morphological type conformity is dominant in groups, and emission class conformity is dominant in pairs. This suggests that group scale conformity is the result of many galaxy encounters over an extended period of time, whilst pair conformity is a fairly instantaneous response to a transitory interaction. Key words: cosmology – galaxies: environment – large scale structure ⋆ E-mail:asgr@st-and.ac.uk 2 A.S.G. Robotham et al. 1 INTRODUCTION variation in star formation, morphology and colour. This indicates that there is no typical evolutionary history for L∗galaxiesexistatthekneeofthepopularSchechter(1976) these‘typical’galaxies. Wecan theoriseaboutalargenum- parameterisation of the galaxy luminosity function. The ber of factors that might directly alter the evolution of any galaxy stellar mass function has a similar form, and as galaxy,includingL∗ones.Anon-comprehensivelistincludes such the knee of the stellar mass function (M∗) represents galaxy-galaxy interactions, local scale environment (e.g. its broadlythesamegalaxypopulation.Duetotheshapeofthe dark matter halo), and the large scale environment of the galaxy luminosity function, L∗ galaxies dominate the inte- cosmic web. gratedmassandluminositydensitiesintheUniverseatlow Many recent studies have investigated the role of redshift (e.g. Baldry et al. 2012;Driver et al. 2012). environment in driving the evolution of galaxies, with To understand the integrated properties of all galax- much contradiction in the literature. Studies on SDSS by ies we can, to the first order, just consider the prop- Weinmann et al. (2006) suggest strong evidence of ‘con- erties that affect the evolution of ∼ L∗ galaxies. Sim- formity’ between central and satellite galaxies in halos ply doing this offers insight into the fate of the median for a given amount of stellar mass, the suggestion from and modal unit of stellar mass in a cosmological vol- Wang& White(2012) being that redder central galaxies of ume. Further to this, apparent magnitude limited sur- a given stellar mass tend to occupy larger halos. This con- veys at moderate redshifts (e.g. 2dFGRS, SDSS, MGC, clusion suggeststhatthehaloenvironmenthasasignificant GAMA, see Colless et al. 2001; Adelman-McCarthy et al. roleindeterminingthepropertiesofgalaxies,ontopofthose 2008; Liske et al. 2003; Driveret al. 2011, respectively) are drivenpurelybystellarmass.Countertothisisrecentwork dominated by L∗ galaxies in terms of raw number counts, by Peng et al. (2010) using z-COSMOS and Thomas et al. eventhoughtheyarenotthemostpopuloustypeofgalaxy. (2010),whoboth broadlyconcludethatonce‘environment’ Thustheyare bothextremelyimportant in determiningin- has influenced the stellar mass of a galaxy (particularly a tegrated properties of mass and light in cosmological vol- centralgalaxy),theremainingpropertiesarepredominantly umes of the Universe, and the most easily studied variety drivenbythestellar mass. This is in alignment with earlier of galaxy by virtue of the double power-law shape of the work by Baldry et al. (2006), which finds thecolour–stellar luminosity function (see Cooray & Milosavljevi´c 2005, for mass and colour–concentration locus of galaxies is uncorre- a discussion on the origin of L∗). By a happy coincidence lated with environment (which in this case is density de- our own galaxy, the Milky-Way,is also an L∗ galaxy. This fined). observational bias is not surprising, since it just means our This work putsthe investigation of L∗ galaxies intoan sunresidesinthemost typicaltypeofgalaxytofindstellar observational cosmological context by using data from the mass. Galaxy and Mass Assembly project (GAMA: Driver et al. The combination of these factors makes a detailed in- 2011). GAMA is a multi-wavelength photometric and spec- vestigation of L∗ galaxies an instructive exercise, informing troscopic survey,andis designed toanswer questionsabout us both about the integrated properties of galaxies in cos- howmatterhasassembledonahugevarietyofscales:galax- mological volumes, and the typicality of our own galaxy. It ies,groups,clustersandfilaments(i.e.alloftheenvironmen- is important that we fully understand any statistical biases tal scales outlined above). The first phase of the redshift present in the Milky-Way since, by virtue of proximity, it surveywasconductedontheAAT(knownasGAMA-I)and will always be the galaxy we can investigate in the most thesedata are used in thiswork (Driveret al. 2011). detail, and from which we can derive the most information GAMA aims to describe the physics occurring in dark about its formation history. matter haloes across the largest mass range ever probed However, question marks remain over how typical within a single survey,spanning at least 3 orders of magni- the MW halo is in the context of the Universe and tude in mass: ∼ 1012h−1M⊙ < Mhalo < 1015h−1M⊙. The how unusual its galaxy occupation statistics are (e.g. GAMA galaxy group catalogue (G3Cv1) was recently cre- Boylan-Kolchin et al.2009,2010,2011;James & Ivory2011; ated using thefirst 3 years of GAMA-I redshift data and is Lovell et al. 2012; Tollerud et al. 2011; Weisz et al. 2011; describedindetailinRobotham et al.(2011,R11hereafter). Robotham et al. 2012). We are set to learn a vast amount This catalogue was constructed using an adaptive Friends- abouttheMilky-Wayinthecomingdecades.Inthenearfu- of-Friends (FoF) grouping algorithm that was extensively ture GAIA (Wilkinson et al. 2005) will measure space mo- tested on mock simulations. The G3Cv1 contains LG mass tions and properties for 2 billion stars in the Local Group haloesouttoz∼0.1, allowing ustobetterunderstandhow (LG) which includes all known member galaxies as part typicalMilky-Waytypegalaxiesarewithinacosmologically of the new era of Galactic archeology studies. Amongst significant volumeof theUniverse. likely discoveries, we will learn about dynamical equilib- This work has been divided into multiple papers. The rium, or lack of it, for the first time. Building up to these firstpaperinvestigatedthespecificoccurrenceratesofMag- hugely detailed surveys it is important we discover where ellanic Cloud mass galaxies around Milky-Way mass (L∗) the Milky-Way fits into the bigger picture. Only then can galaxies—thisisanovelquestioninitsownrightsincemuch weapply what weknowabout theMilky-Wayto cosmolog- cosmology depends upon the typicality of the Magellanic ical galaxy formation models. Combining near-fieldcosmol- Cloud satellites of the Milky-Way (Robotham et al. 2012). ogy (LG scale) and far-field cosmology (redshift surveys) Thissecondpaperinvestigateshowthedefiningcharacteris- is key to completing the full picture of galaxy formation tics of L∗ galaxies (type, morphology, star formation rates, (Freeman & Bland-Hawthorn 2002). halomassandstellarmassamongstothers)varywithin the L∗ galaxies are observed to have extremely wide rang- totalgalaxypopulation,groupedgalaxiesandclosepairsys- ing properties, inhabiting a regime where we see the most tems.Thiswillanswerquestionsonwhatphysicsaredriving GAMA: The Life and Times of L∗ Galaxies 3 thecharacteristicsofL∗galaxieslikeourownMW.Thefinal mation of thick disks and pseudo bulges (e.g. Haywood planned paperwill measuretheluminosity function of MW 2008; Kormendy & Kennicutt 2004, respectively). Orbital mass halos, revealing how typical the dwarf galaxy popula- properties are also able to be changed more dramati- tion of the MW is. cally and violently during encounters with other galaxies There has been much written in the literature about (Barnes & Hernquist 1992a). Minor merger eventscan pro- the different physical processes that have a measurable ef- duce subtle changes to stellar orbits, providing another fect on the properties of a galaxy. Recent key observa- mechanism for the creation of a thick disk (Read et al. tional discussions regarding the influence of environment 2008).Majormergerscanbeincoherentenoughtotransform on the properties of galaxies include Baldry et al. (2006); a galaxy with regular rotational disk-like stellar structure Weinmann et al. (2006); Peng et al. (2010); Thomas et al. (thecanonical late-typegalaxy) intoasystem with random (2010); Kauffmann et al. (2012). The complicating factor orbits (thecanonical early-typegalaxy). hasalwaysbeeninseparatingouttheclearprimaryrolethat Self-evidently‘secular’processesarenotadirectconse- localenvironmenthasinproducingaparticulardistribution quence of environment since they describe processes that ofgalaxies (e.g.luminosityorstellarmass:Robotham et al. should occur regardless of outside influence / triggering, 2006; Weinmann et al. 2006) and second order processes therefore they might be expected to be entirely predictable thataffectpropertiesofthesegalaxies(e.g.colourandmor- from theinstantaneouspropertiesofagalaxy.However,en- phology: Driveret al. 2006; Kelvin et al. 2012). vironment can play a role in disrupting secular processes, Themajorrolesthatagroup(orhalo)hasinassembling e.g. a major merger would destroy any bar formation pro- stellarmassare:feedinggasintogalaxiestoenhancestarfor- cess. Clearly thereis scope for environment to play at least mation(Keres et al.2005;Dekel & Birnboim2006);heating a secondary role in almost all aspects of galaxy evolution, and stripping gas out of galaxies (e.g. Gunn & Gott 1972; if only by virtue of disruption, delay and prevention mech- Abadiet al. 1999; Balogh et al. 2000; Dekel& Birnboim anisms. Thepurposeof thispaperis tosimultaneously sep- 2006) or stripping of stars directly (Bekkiet al. 2001) and arate out the stellar mass, galaxy-galaxy interaction, and providing a location for rapid galaxy-galaxy interactions halo mass terms in order to quantify the codependencies of (Barnes & Hernquist 1992a), be they harassment, minor or secularlyandenvironmentallydrivenstellarmassevolution. major merger processes (e.g. Moore et al. 1996; Cole et al. Secondarypropertiesofgalaxiesclearlydisplaydiffering 2000, respectively). All of these processes provide mecha- sensitivitytomodifyingexternaldrivers.E.g.Hαequivalent nismsforstellarmassbuild-upingalaxiestobeeitheraccel- width (EW) is arelatively instantaneous response toan in- eratedordecelerated,andwillhavenoisyaverageneteffects crease in star formation, accompanied by a change in inte- as a function of stellar mass, halo mass and epoch. Except grated bandpasscolour to bluercolours. In the longer term for the tidal dwarf variety of galaxies (Barnes & Hernquist thein-situgasandlocked-upstellarmetallictywillincrease, 1992b) allgalaxies areassumed tobelocated within adark which will create a redder SED. If this burst of star forma- matterhaloofsomedescription,thoughtodatenorotation tion occurred due to a minor merger event then we might curve has been measured for a ‘tidal dwarf’ that does not also expect orbitstobecome disrupted,leadingto achange require some ‘dark’ component (Bournaud et al. 2007). We in the velocity dispersion and light profile of the galaxy. If can therefore say that galaxy stellar mass is entirely cou- thechangeisdramaticenough(e.g.amajormerger)itmight pled to environment, which is not to say the coupling is alsoinvokeachangeinthe‘type’classificationofthegalaxy. trivial. The fact it is not trivial has invited a large variety Thus we have galaxy properties that are highly sensitive offeedbackmodelsintheliterature(e.g.Benson et al.2003; to current star formation invocations (Hα-EW) and ones Bower et al.2006;Croton et al.2006).Beyondthis,itisless that betray more about the integrated history of a galaxy clear-cut what additional role the environment has on the (some component of colour and all aspects of morphology). observed properties of galaxies. Depending on the physical processes that caused star for- The second order properties of galaxies (those things mation we might also observe longer term changes to the that are not stellar mass) can be largely divided into two morphology of the galaxy (in the case of minor or major categories: luminous energy characteristics (any aspect of a merger events). In this work we aim to separate out these galaxy defined by light output as a function of wavelength: differentsecondarypropertiesintothosemostdependenton starformationrate(SFR)andgalaxycolouretc)andorbital different likely primary drivers of galaxy properties: stellar energy characteristics (aspects concerning the position and mass, halo mass and galaxy-galaxy interactions. velocityofstars:morphologyandcolourgradientsetc).Pro- In Section 2 we discuss the data used in this work in cessesthatcanaffecttheluminousenergycharacteristicsare detail.InSection3wediscussthesampleselectionsapplied mostly those that directly enhance or suppress star forma- to the data. In Section 4 we describe the visual classifica- tion (which is then necessarily coupled to the stellar mass tion process that was used to categorise the morphological build-up discussed above) and more contentiously any pro- type,emission class and presence of a disk. In Section 5 we cess that affects the initial mass function (IMF) that stars discuss the different varieties of galaxy categorisation used are forming with (see Gunawardhana et al. 2011, for recent for constructing later plots. In Section 6 we analyse how work on variable IMFs). properties of MW mass galaxies are affected both by the Orbital properties within galaxies can evolve natu- group-scaleandpair-scaleenvironment,wherethecodepen- rally through ‘secular’ processes that allow for orbital en- dence of galaxy properties is discussed in detail. In Section ergy redistribution, which we observe as brief and vary- 7wepulltogetherthemainresultsofSection6intoacoher- ing manifestations such as pattern bars and spiral arms ent narrative and put the findings into context. In Section (e.g. Sellwood & Wilkinson 1993; Bertin et al. 1989, re- 8 we briefly summarise themajor findingsof thework. spectively), or permanent transitions such as the for- In this work we use ΩM = 0.25, ΩΛ = 0.75 and H0 = 4 A.S.G. Robotham et al. 70kms−1.Thisisconsistentwiththefirstpaperinthisseries correction for the majority of our work. The fidelity of the that dealt specifically with the commonality of Magellanic spectral classifications is investigated below. Cloud galaxies around L∗ systems (Robotham et al. 2012). 2.3 G3Cv1 2 DATA One of the principal science goals of GAMA is to make a statistically significant analysis of low mass groups (M 6 2.1 GAMA 1013M⊙), helping to constrain the low mass regime of the The Galaxy and Mass Assembly project (GAMA) is a ma- dark matter halo mass function and galaxy formation ef- jor new multi-wavelength photometric and spectroscopic ficiency in Local Group like haloes. This low mass regime galaxy survey (Driver et al. 2011). The final redshift sur- contains groups that have halo masses similar to the LG, vey will contain ∼300,000 redshifts to rAB = 19.8 over allowingustoinvestigatehowcommontheLGenvironment ∼280 deg2,withasurveydesignaimedatprovidinganex- is, and puttingLGscience into a cosmological context. ceptionally uniform spatial completeness (Robotham et al. The GAMA-I spectroscopic data was used to con- 2010a; Baldry et al. 2010; Driveret al. 2011). struct the first GAMA galaxy group catalogue (G3Cv1: Extensive details of the GAMA survey characteristics Robotham et al. 2011). This group catalogue was con- are given in Driveret al. (2011), with thesurvey inputcat- structed using an adaptive Friends-of-Friends (FoF) algo- alogue described in Baldry et al. (2010) and the spectro- rithmthatwasoptimisedtorecovergroupsinthemagnitude scopictilingalgorithminRobotham et al.(2010a).Thefirst limited GAMA-I spectroscopic data. 3 years of data obtained has been frozen for internal team Intotal G3Cv1contains14,388 groups(with multiplic- use and is referred toas GAMA-I. ity>2),including44,186 galaxies out of apossible 110,192 Briefly, the GAMA-I survey covers three regions each galaxies, implying ∼40% of all galaxies are assigned to a 12×4degreescentredat09h,12hand14h30m(respectively group.SinceGAMA-Ihasanunevenr-bandselection func- G09,G12andG15fromhere).Thesurveydepthsandareas tionbetweenGAMAregionsweuseanr<19.4magsubset relevant for this study are: ∼ 96 deg2 to rAB = 19.4 mag of the full G3Cv1 for this work. This catalogue has 37,576 (G09 and G15) and ∼ 47 deg2 to rAB = 19.8 (G12)1. All galaxies in 12,200 groups. regionsaremorethan98%complete(seeDriveret al.2011, The G3Cv1 contains a wealth of ancillary data regard- for precise completeness details), with special emphasis on ingthepropertiesofthegroups,includingdynamicallyesti- a high close pair completeness, which is greater than 95% mated halo masses. These halo masses are used extensively for all galaxies with up to 5 neighbours within 40′′ of them in this work. For details regarding the reliability and bi- (see Fig. 19 of Driveret al. 2011). Stellar masses used for ases the reader should refer to Robotham et al. (2011) and this work are taken from Taylor et al. (2011). Alpaslan et al. (2012). 2.2 Spectral Analysis 2.4 Pair Catalogue The spectra collected during the GAMA observations have This paper is investigating the effect that various kinds of been flux calibrated, Balmer decrement corrected, aperture environmenthaveonthecharacteristicsofL∗galaxies.Close corrected,andtheemissionlineequivalentwidthsmeasured. galaxy interactions have a significant role on the evolution The spectral pipeline process is discussed in detail in Hop- of galaxies, so these systems are selected for close analy- kins et al. 2013 (in prep). The line measurements havealso sis in this work. Part of the process of creating the G3Cv1 been converted into star formation rates, a process that is catalogue involves the construction of all galaxy pairs (see described in Gunawardhana et al. 2013 (in prep). These Robotham et al. 2011, for details). This catalogue contains SFRsare used directly in this work. galaxies with potentially quite large radial (velocity) and Theseemission linemeasurementsarealsousedforau- tangential (spatial distance) separations between galaxies. tomatic spectral classifications bycomparing the[OIII]/Hβ Usingthefullpaircataloguewouldincludegalaxypairswith as a function of [NII]/Hα in the popular manner outlined very large dynamical times, and such pairs will have weak in Baldwin et al. (1981), widely known as BPT classifica- evolutionary effects on the component galaxies. Instead we tion. This process, and the classifications selections used, select a narrow window of interaction phase space in order are discussed in detail in Hopkins et al. 2013 (in prep) and to preferentially extract galaxies that will be most affected Gunawardhana et al. 2013 (in prep). These automatic clas- by close galaxy-galaxy interactions. The ‘close pair’ sample sifications are supplemented by extensive visual checks to selected hereisbased on thatpresentedin Robotham et al. minimise classification errors (discussed below). (2012), where we aimed to recover galaxy pairs that are For this work we keep the classifications as simple as similar to the MW Magellanic Clouds system. This ensures possible: Hα emission that is dominated by star formation wecaninvestigateavarietyofinteractionthatourownMW irradiation, Hα emission that is dominated by AGN irradi- L∗galaxyhasexperienced,helpingtoplaceitinthebroader ation and no Hα emission. This binary definitions of star family of L∗ galaxies. formation means we are highly insensitive to the details of The SMC is ∼ 60kpc from the MW and travelling flux calibration, Balmer decrement correction and aperture radially away at ∼ 17kms−1 and 301kms−1 tangentially with respect to the MW: a net velocity of 302kms−1 (Nichols et al. 2011). The LMC is ∼ 50kpc from the MW 1 SeeBaldryetal.(2010)foradditional GAMA-Iselections. and travelling radially away at ∼ 89kms−1 radially and GAMA: The Life and Times of L∗ Galaxies 5 Galaxiesinpairedsystems Frequency Totalgalaxies etiesof‘environment’investigatedinthiswork:galaxypairs and galaxy groups. These are just two of an infinite num- 2 4,550 9,100 ber of possible definitions of environment, but they probe 3 370 1,110 4 45 180 the smallest physical scale environments possible, and as 5 4 20 such should possess the cleanest possible relationship be- 6 1 6 tween environment and galaxy properties due to the recent dynamical events. To link this work closely with our own Table1.Numberofpairsystemswithdifferentnumbersofgalax- MW environment (important since so much effort is being ies. invested in surveys of the MW and local galaxies), we are careful to ensure that our definitions of ‘pair’ fully capture 367kms−1 tangentially with respect to the MW: a net ve- interactions like the MW is undergoing with the LMC (its locity of 378kms−1 (Nichols et al. 2011). To conservatively dominant pairwise interaction). We also select all groups thataresimilar masstotheMilky-Wayhalo,allowing usto recover all systems where the galaxies are in such spatial– investigate how common the MW system is, given its halo velocity proximity, we create a catalogue of pairs for this mass as a prior. work where the projected separation is rsep−proj < 70kpc and the radial velocity separation is vsep−rad <400kms−1. First we add our pair selection criteria. We include all pairs within a redshift limit of z =0.089 that have at least SeeRobotham et al.(2012)fordetaileddiscussionongalaxy one member selected in the mass sample described above. pair selections. Thisallows ustoobserveLMCequivalentgalaxiesthrough- Applying these selection limits to recover all systems out our sample (see Robotham et al. 2012, for details of thathavesimilar pairwise dynamicalpropertiestotheMW theselectionlimits).Togetherwiththelowerredshiftlimitof and the Magellanic Clouds creates a catalogue containing z=0.01thisgivesasampleof3,503galaxies.Inthisworkwe 5,964 galaxy pairs and 10,416 unique galaxies. These num- use stellar mass rather than r-band magnitude to describe bers are for the whole GAMA-I dataset, so include stellar the galaxies, and the redshift limit z =0.089 is specifically massesthatmightbehighlydissimilartotherealMWMag- the implied r-band magnitude limit to observe LMC type ellanic system. galaxies.However,sincetheLMCisblue,late-typeandstar Some galaxies will be members of more than one pair formingthiswillactasaveryconservativeLMCstellarmass (theMWispairedwithtwogalaxies—theSMCandLMC). Wecreate groupingsthat contain all galaxy-galaxy associa- limit.IndeedtheMs >MS,LMC numbercountsdropoffat a z ∼ 0.1. For consistency with Robotham et al. (2012) we tions and count this as a single ‘pair’ system, e.g. the MW use the more conservative limit of z =0.089 to select down is in a pair system of 3, as are the SMC and LMC. In the to LMC mass galaxies. same way that simple galaxy pairs are only counted once, In order to determine what role different environments higherorderpairsystems arealso only countedonce. Table may have on the evolution of L∗ systems, we then select 1 shows the frequency of different pair systems of galaxies. all galaxies that are in any G3Cv1 group or galaxy-galaxy Whilstwerecover5,964galaxypairs,oncecommonlinksare pair containing any of the 3,503 galaxies in the above sub- explored we are left with 5,446 systems. set.Thisgivesusanexpandedsampleof5,054galaxies. We add to this all galaxies in all groups that have a G3Cv1 halo mass between 7×10¹¹M⊙ <MFoF < 1013M⊙ where 3 SAMPLE SELECTION MFoF is defined using thefunctional form of thehalo mass Alargecomponentoftheanalysisrequiredforthispaperre- usedinRobotham et al.(2011).Thishalo massrangecom- quired comprehensive visual classification (described in de- fortably covers both sides of the MW halo mass used in tail below). The task of visually classifying the data in this Robotham et al. (2012, 2.5 × 10¹²M⊙) and the total LG mannerwasextremelylabourintensive—eachgalaxycould mass(MW+M31haloes=∼5×10¹²M⊙:Li & White2008). take a minute to analyse and GAMA-I contains 129,765 Including this halo mass range guarantees that all systems galaxies with redshifts above 0.01. Doing this for 8 hours withpropertiessimilartotheMWbyvirtueofstellarmass, a day would take 270 days. Instead we selected a subset of and halo mass or close pair interactions, are certain to be galaxies concentrated on L∗ systems (the focus of this pa- includedinoursample.Thisgivesusafinalsampleof6,150 per), and systems that share common properties with the galaxies to visually classify in detail. As long as the stel- MW and its local environment (allowing us to identifying lar mass and halo mass ranges are kept within the limits theevolutionary drivers for theMW). described above,this sample is volumelimited. Sincethisworkispredominantlyinterestedintheprop- The result is our sample has two major components: erties of MW mass (L∗) galaxies we had to comfortably in- • AllGAMAgalaxieswithMS >1010M⊙(masssample, clude all GAMA galaxies with stellar mass similar to the with 3,550 galaxies). MW(5.0×10¹⁰M⊙:Flynn et al.2006).Aconservativelower • Within 0.01 < z < 0.089, all pairs and groups are in- stellarmasslimitofMS =1010M⊙ waschosen.Duetothe cluded that have at least one member in the above mass rapiddecreaseinthenumberofobjectsaswemoveintothe selection. These two varieties of environment are therefore higherstellarmassregimetherewasnoneedtoimplementa completedowntoLMCmassgalaxies.InadditionallG3Cv1 higherstellarmasscut-off.Intotalthisstellarmassselected groupswithahalomassintherange7×1011M⊙ <MFoF < sampSlienccoenwtaeianrse3a,l5s5o0ingvaelasxtiigeas.tingtheenvironmentthatL∗ 1013M⊙ and 0.01 < z < 0.089 (volume sample, with 6,150 galaxies). galaxies reside in, we add all galaxies that are associated with the L∗ selection to the sample. There are two vari- Plots that only require a mass selection are defined by 6 A.S.G. Robotham et al. the mass sample. Any plot the makes use of pair or group but distinct disks. Whilst late-type galaxies, by their def- information is defined by the second volume limited selec- inition, always possess a disk like structure, there exists a tion. By using this combination of stellar mass, group and large fraction of early-type galaxies where this might be a pairselectionsweareabletoinvestigateallofthekeychar- keydistinguishingvariable(weincludeS0andlenticularsin acteristics that definetheMW and theLG environment. thisclass). To determine classes for these three categories a large subset of the GAMA-I survey was studied in detail by ASGR.Usingthesingleobjectviewer(SOV)tooldeveloped 4 VISUAL INSPECTION OF THE DATA by JL it was possible to view the following information si- Inthisworkweareprimarilyinterestedinhowthepresence multaneously for each galaxy: ofagroupenvironment,oranothernearbygalaxy,canaffect • colour image; the characteristics of a given stellar mass galaxy; particu- • basic catalogue information; larly in theregime of MW mass galaxies (i.e. L∗ galaxies). • preferred spectrum; Toundertakesuchanalysis it isnecessary toknowvar- • 2D modelling information, including difference image; ious characteristics about L∗ mass galaxies (i.e. thekneeof • 1D surface brightness profile. the stellar mass function, M∗). Some of these characteris- ticscanbedetermineddirectlyfromthedata:colour,mass. Figure 1 is a screen grab of the SOV tool for GAMA Othersaremoredifficulttoextractfromthedataduetothe galaxy 6926. Using the information available in the SOV subjectivenatureofthevariableortheimperfect quality of ASGRassessed the following 3 galaxy characteristics: thedata. • whetherthegalaxyislate-type(visiblydiskdominated) Galaxy type,bywhich wemean morphologically early- or early-type(visibly bulge dominated); typeorlate-type,isdifficulttodeterminefromthecatalogue • whetherthegalaxy hasanyevidencefor adisk (binary data directly. When analysing a fiducial sample of galax- trueor false); iestakenfrom Kelvin et al.(2012)therelationship between • whether the galaxy exhibits star forming Hα emission, S´ersic index and morphological type is highly imperfect: it no Hα emission or is an obvious AGN (broad emission fea- isnottruetosaythathighS´ersicindex(n>3)galaxiesare tures). early-type and low S´ersic index (n < 3) galaxies are late- type. Inclination in particular can distort catalogue values, Thethreeclassificationsusedtoquantifyemissionclass and the reliability of colour as a galaxy ‘type’ discriminant are shown in Figure 2. As well as assessing galaxies for is heavily compromised by thepresence of dust. these different classes, data quality was simultaneously Starformationrate(orspecificstarformationrate)ap- checked.Galaxieswereassessedastowhethertheyweresub- pearstobeacharacteristicthatiswellsuitedtocatalogued structureoflargergalaxiesormisclassifiedstarsthathavea data. However, analysis of a fiducial sample revealed that redshift virtue of background galaxy flux. 16 galaxies were the current emission line based SFRs (Hopkins et al. in re-classifiedassubstructureand6galaxieswerere-classified prep) fail to detect SFRs for ∼20% of galaxies where the as stars, i.e. 99.64% of galaxies in our original sample were emission line is very weak and the spectrum has low S/N. correctlyidentifiedasbeinggalaxies(seeBaldry et al.2010, The lack of a measurement is not an error, rather a prag- for details of the original GAMA star galaxy separation). matic decision to improvethereliability of quoted SFRsby Finer resolution grading of properties was not possi- ignoring marginal lines. A particular problem is that these bleovertheredshiftrangeprobed,i.e.itwasnotpossibleto undetectedweaklystarforminggalaxiesaretypicallyfainter reliablyidentifytheHubbleclassorsimilarlowerorderclas- lowermasssystems,creatingastellarmassbiasinouranal- sifications.Thepropertiesassessedweresubjectivelyconsid- ysisofstarformation. Also,at presentGAMAincorporates ered to be the most information that could be robustly ex- spectra from non-AAOmega sources (e.g. SDSS, 2dFGRS) tractedgiventhequalityofdata.Toguidelaterdiscussions, andemissionlineanalysishasnotyetbeenrunontheentire lenticulargalaxiesandearly-typespiralgalaxieswouldboth sample. This has a larger effect at lower redshifts, which is beclassified as early-typegalaxies possessing disks. the regime of interest in this work, since a larger fraction ofspectraarenon-AAOmegaforbrightermagnitudes.Ulti- mately,independentlyidentifyingspectralemissionfeatures 5 GALAXY CATEGORISATION visually was deemedtobeanappropriate routeforward for the science investigated in this paper, where we are mostly For multi-dependent data mosaic plots are a very power- interested in the binary divide of star formation: on or off. ful and information rich means of visualisation. They differ Thisrouteofinvestigationisinformedbyrecentstudies(e.g. fromprincipalcomponentanalysis(PCA)inthattheyread- Wijesinghe et al. 2012) showing the star forming fraction, ily handle discrete data classes, which PCA does not. For not the rate of star formation, is the property sensitive to readers unfamiliar with how mosaic plots are constructed, ‘environment’. This requires us to push the usable S/N and best interpreted, AppendixA describes them in detail. limits of the catalogues, which is discussed in more detail Itisstronglyrecommendedthatnovicestothemosaicplot- below. ting technique start there. To ease the comprehension of The presence, or otherwise, of a disk is also a key thelargenumberofplotspresented,themajorobservations characteristic that is difficult to extract from catalogued drawnfromeachfigureareincludedintherelevantcaptions. data. Using the data−model residual images produced by Thisshouldbeparticularlyhelpfulinexplainingthemosaic Kelvin et al.(2012)itwasclearthatalargenumberofearly- plots to those unfamiliar with them. type galaxies, even with high S´ersic indices, possess weak In order to present information in the form of mosaic GAMA: The Life and Times of L∗ Galaxies 7 Figure2. Examplesofthethreeemissionclassesusedforvisual classification. Top panel shows broad line features due to high velocity emission from an AGN (class A). Middle panel shows highequivalent width Hα emissionrelative to all other emission lines, so a star formingspectrum (class S). Bottom panel shows nosignsofanyHαemissionontopofthecontinuum (X). plots all information must be discretised. Some categories are naturally discrete: morphological type and presence of Figure 1. Screen grab of a typical display using the SOV tool disk.Othershavetobecoercedintodiscretecategories:SFR available for the GAMA database. Top-left is an image taken (as outlined above). Here we describe all of the galaxy cat- directlyfromtheSDSSimageserver.Top-rightaresomekeycat- egorisations that are used to construct later mosaic plots, aloguevaluesforthecurrentgalaxy.Inthemiddleisthepreferred alongwiththeabbreviationinparenthesesusedforlabelling. GAMAspectrumwithpositionsofemissionandabsorptionlines over-plotted. Directlybelowthespectrumisalistofother avail- ablespectraintheGAMAdatabase (usefulwhentherearedata 5.1 Naturally Discrete Galaxy Categories quality issues in key regions of the preferred spectrum). In this example the only available spectrum is from 2dFGRS. Bottom- Belowarelistedallofthenaturallydiscreteclassesofgalaxy leftistheimageoutputofKelvinetal.(2012).Withinthispanel propertiesinvestigated.Thedeterminationofthesedivisions thetop-leftistheutoK-bandimage(r-bandisthedefault,but requirelesssubjectivity thanforcontinuousdata.However, others can be selected by clicking on the links above), top-right not all categories are fully objective— opinion is still re- is the final Galfit model, bottom-left shows the ellipses used to quired to determine whether a galaxy is early-type or late- construct the 1D surface brightness profile, bottom-right is the type. data−modelresidualimagewiththelocalPSFoverplotted.The bottom-rightofthewholefigureisthe1Dsurfacebrightnesspro- fileestimated usingIRAFEllipse,withkey values regardingthe 5.1.1 Galaxy Type fitprintedinsidetheplotwindow. Early-Type(e) / Late-Type(l) As part of the visual classification process outlined in Section 4, galaxies are categorised by simple Hubble type. The divide used was whether the galaxy appeared to be bulge dominated (Re inside the bulge regime, which is determinedbya strongvisual breakin the1D light profile) 8 A.S.G. Robotham et al. ordiskdominated (eithernobulge,orRe outsidethebulge 5.2 Naturally Continuous Galaxy Categories regime). This estimation is informed by both multi-band Below are listed all of the naturally continuous classes of and r-band SDSS images, and the 1D profile of 2D single galaxy properties investigated. The determination of these S´ersic fitsgenerated byLSK (seeKelvin et al. 2012, for de- divisionscontainsomesubjectivityonourpart.Makingcon- tails on thesingle S´ersic fittingprocess). Furtherresolution tinuousdatadiscreteobviouslyreducestheinformationcon- beyond early-type and late-type is not attempted due to tent available to us, but in practice it is often theonly way the quality of the data. Lenticulars (S0) galaxies would be to visualise behaviour of noisy relationships: it is common classified as early-type in this scheme, as would early-type practice to plot the running median in scatter plots, which spiral galaxies. isadiscreteseparationofthedata.Evenbinningdatawhen plotting a luminosity function is a discretising process. Ob- viously any further numerical analysis should make use of 5.1.2 Galaxy Disk theunderlyingcontinuousdata. False (F) / True(T) As part of the visual classification process outlined in 5.2.1 Emission Strength Section 4, galaxies are assessed to either possess some form AGN (A) / StarForming (S) / No Emission (X) of disk, or not. This subjective observation is based on the r-band S´ersic profile subtracted residual images created by As part of the visual classification process outlined in LSK (see Kelvin et al. 2012, for details on the single S´ersic Section 4 galaxies are visually assessed into these three fitting process). Further detail beyond this binary status is classes of emission. AGN classes (A in plots) are those not attempted due to the quality of the data. Lenticulars with clear Hα emission, but where the spectral signature (S0)galaxies would beclassified aspossessing adisk inthis is dominated by AGN irradiation. Star forming classes scheme. (S in plots) are those with clear Hα emission, but where the spectral signature is dominated by star formation irradiation. No Emission classes (X in plots) are those 5.1.3 Galaxy in Group without any Hα emission, though other lines may still be present (typically weak [NII]). False (F) / True(T) Figure 2 gives an example of each. Galaxies were both spectrally classified through a classic BPT separation Logic class defining whether a galaxy is found within (Baldwin et al.1981)andbyeye.TheGAMAapplicationof aG3Cv1groupthatmakestheselection criteriaoutlinedin theBPTseparation isdescribedindetailinGunawardhana Sec3. etal.2013(inprep)andHopkinset al.(2013),andincludes all GAMA and SDSS origin Spectra (which covers 92.2% of the sample investigated here). In the automatic classifi- 5.1.4 Galaxy is Central or Satellite cation scheme a galaxy is classed as ‘X’ when it cannot be placedonaBPT,i.e.itismissingatleastoneoftheHα,Hβ, Central Galaxy (C) / Satellite Galaxy (S) [OIII] or [NII] lines. This differs to the definition desired in thiswork, that ‘X’ refers only to systems with no Hαemis- Class defining whether a galaxy is the largest (in terms of sion.Byusingthisdefinitiontheseparationbetweenclasses stellarmass) in itsgroup,otherwisereferred tointhiswork is much clearer. asthebiggestgroupgalaxy(BGG).Ifitisthenitisdefined Separatelytothispurelyautomaticprocess,allspectra as the ‘central’ galaxy (C), otherwise it is a ‘satellite’ (S). were classified by eye. It is easy to identify AGN spectra All ungrouped galaxies are defined as central galaxies in when there are broad emission line features, but these are their group of multiplicity 1 (but these 1 member groups do not count as part of theG3Cv1). a minority of cases. In other cases the decision was made by dividing the height of the [NII] and Hα features, and classifying the galaxy as AGN when this ratio was clearly above 0.5. This uses part of the information available in 5.1.5 Galaxy in Pair System a formal BPT analysis, and will be approximate at best. False (F) / True(T) As such, a clear weakness of visually classifying spectra is separating marginal BPT classifications. All disagreements Logic class defining whether a galaxy found within a were followed up at least once and a discernment made be- G3Cv1 pair system that makes the selection criteria tweencaseswheretheautomaticprocesswasdistinguishing outlined in Sec 3. between subtle emission ratios that cannot be accurately determined byeye,and those wherean fittingerrorhas oc- curred,creating a poor automated fit. In cases where the BPT was able to select marginal 5.1.6 Galaxy is Largest in Pair System AGN systems and Hα, Hβ, [NII] and [OIII] were all in False (F) / True(T) emission, the BPT was preferred. However, the majority of BPTselectedAGNclassificationsweretenuouslowpowered Logic class defining whether a galaxy is the largest LINER-like systems with no significant Hα, Hβ or [OIII] (in terms of stellar mass) in its pair system. flux. In these situations only a weak [NII] line was present GAMA: The Life and Times of L∗ Galaxies 9 Visual Spectral Class 10-3 10-2 10-1 100 101 102 103 A S X AGN (A) A 154 4 644 1 Star Forming (SF) 1 Non Star Forming (X) 8 8 0. 0. 6 6 F 0. 0. D P 4 4 0. 0. T ClassS8 3298 415 0.2 0.2 P B o Aut 0 0 10-3 10-2 10-1 100 101 102 103 Ha −EW Figure 4. Comparison of the Hα-EW PDFs for the AGN (A), star forming (S) and non star forming (X) classifications used X 68 229 818 in this work, where the Hα emission has been measured during the GAMA line measuring process (see Hopkinsetal. 2013, for details). As expected, where Hα has been measured the EW is NA 8 351 119 significantlyhigherforstarformingcomparedtononstarforming galaxies, with AGN classed galaxies sitting broadly between the two.Toaidcomparisonwithother workwesuggestdividingthe Hα-EW at 1 (vertical dashed black line) and classing galaxies Figure 3. Mosaic plot comparing the automated BPT classifi- abovethisthresholdasAGN/starformingandclassinggalaxies cations (horizontal bands) versus the visual classifications (ver- belowthisthresholdasnonstarforming. tical coloured bands). For both classifications A=AGN, S= star formingand X= non star forming.For the visual classifications, green= AGN,blue= star formingand lightred= non star form- ing. The most disagreement comes for AGN classes (A) where Figure4demonstratestheHα-EWdistributionsforthe verylowpoweredLINER-likesystemswithnovisibleHαarebe- ingclassedasAGN.SincewearemostinterestedinHαemission, final classifications used in this work. Star forming galaxies and only wish to exclude cases where a large component of the have a typical Hα-EW at least a factor 10 and on aver- HαfluxisduetoAGNactivity,theseobjectsaremostlymovedto age a factor 100 larger than the visually identified non star thenoemissionclass(X).Spectratakenfromsurveysotherthan forminggalaxies. Themajority ofnonstarforminggalaxies GAMA and SDSS do not have an auto classification (shown as donothaveanymeasuredHαflux(83.8%).Thisplotshows NA). For adetailed descriptionof how to interpret mosaicplots thePDFsforthesmallfractionthathavesomefluxdetected thereadershouldrefertotheAppendix. duringtheautomatedlinemeasuringconductedforGAMA Observations: (see Hopkinset al. 2013, for details). An approximate ver- -Strongagreement for‘S’classemissions. sion of ourclassifications can bemadeusingHα-EW alone: -LargefractionofautoAGNclasseshavenoHαemission. 97.6% of galaxies that have an Hα-EW above 1 are either AGN or star forming, and 93.3% of galaxies with Hα-EW (as in the bottom panel of Figure 2), and the classifica- below 1 (including non measurable) are non star forming. tion was changed to ‘X’, since there is no strong Hα flux. Using Hα-EW alone does not allow for a clean separation This is the main source of disagreement revealed duringvi- of AGN and star forming galaxies (hence the popularity of sualclassificationofspectra.Itisimportanttochangethese BPTdiagramsandsimilarschemes),butthesedivisionswill classificationssinceasignificantnumberofAGNare,bythe allow some of the more dramatic results to becompared to definitions we wish to use, erroneous. otherwork. Figure 3 summarises the BPT versus visual classifica- The AGN classifications contain within them complex tion. Overall 75.4% of automated BPT classifications agree subclasses that we do not attempt to resolve in this work: with the visual classifications. For AGNs the figure drops i.e. QSO,Seyferttype1and 2,and strongLINERgalaxies. to 19% for the reasons described above (only exceptionally Since the physical origin of these different classes are quite obvious AGN can be reliably picked out by eye). For star different and some of the variation is due to observational forming systemstheagreement ishigh,at88%. Finally,the bias(e.g.distinctionbetweenSeyfertclassesislargelyobser- non emission classes agree at the 73% level. In addition, a vationalorientation),wewillfocusthisworkonthestarfor- non-negligible (7.8%) fraction of sources do not have SDSS mation (S) and noemission (X) classes. However,theAGN orGAMAspectra,thereforetheydonothaveaBPTclassi- classes will be listed in all mosaics in order to accurately fication in the GAMA database (see bottom panels of Fig- representthefullpopulationfractions.Inourfinalcategori- ure3).Thesesystemshadtobeclassed entirelybyeye,but sations,3.9% ofgalaxiesareAGNwith Hαemission, 63.1% broadlyreflecttheoverallclassificationdistributionsseenfor havestarformingHαemission,and32.5%havenoHαemis- the full sample. The main survey source for these galaxies sion. The final 0.5% of objects are not real galaxies, either without an automated BPT classification is 2dFGRS. stars or substructureof extendedgalaxies. 10 A.S.G. Robotham et al. 5.2.2 Colour 0.4 0.6 0.8 1 Blue (b) / Green (g) / Red (r) Ms» Ms-MW 0 0 0 0 Colour is an important characteristic of a galaxy. Here 0 0 3 3 we treat colour as a purely relative quantity, and we use g − r because we have detections in both bands for all 0 0 galaxies. It is known that the bimodal nature of galaxy 0.1 200 200 d colour is enhanced by using a bluer band than g since N/ this only partly samples blue-wards of the 4000 ˚A break 0 0 0 0 (Baldry et al. 2004), but since colour does not form the 10 10 main focus of future analysis, completeness was preferred. Also, since we dividecolour intorelative quantiles, thelack blue green red ofg−r bimodalityshouldnotdramatically alterlaterplots 0 0 since bluer galaxies do tend to be bluer in both X−r and 0.4 0.6 0.8 1 g−r,whereX isanybandbluerthang.TheGalactic dust g−r corrected and k-corrected (using k-correct and GAMA’s Figure 5. The distribution of g−r colours for galaxies with ugrizYJHKphotometry,Blanton & Roweis2007;Hill et al. 2011, respectively) g − r colour is separated into three stellarmasseswithin0.15dexofMS,MW.Theblue/green/red divisionsusedareshownbythedifferentcolouredshading.Selec- equal sized quantiles of data for galaxies within 0.15 dex tionshownisthemasssample(Sec3). of MS,MW. The limits of the quantiles are used to define Observations: galaxies as blue,green or red in a relative sense: - There is no clear bimodality in the g−r colour for the MW stellarmassselectionusedtodefinethecolourquantiles. -Thebluepopulationselectsthemajorityoftheoutlyingwingin g−r<0.77 = Blue(b) theg−rdistribution,whilstthegreenandredpopulationsample 0.77<g−r<0.86 = Green(g) different sides of the main population peaks. This suggests that the green and red selections are likely to be selecting galaxies g−r>0.86 = Red(r) drivenbysimilarphysicalprocesses. Figure 5 shows thedistribution of g−r colours for the The discrete halo mass bins are defined in a similar vein massselectionused,andhighlightsthedivisionsused.There to the stellar mass bins: adjacent bins vary in mass by a isnoclearbimodalityforthismassselectionandcolourcom- factor two, and each bin therefore contains a mass range bination,althoughthebluegalaxiesexistinadistinctwing. of ±0.15 dex. Halo masses are taken from Robotham et al. The green and red galaxies are largely selecting different (2011),andarethevariablyscaled(withredshiftandgroup sides of thedominant colour distribution peak. multiplicity) dynamical masses that are discussed in that work. MH,MW uses the halo mass of the MW calculated in 5.2.3 Stellar Mass Li & White (2008): MH,MW = 2.5×10¹²M⊙. The Y = 1 bin corresponds to haloes with MW and M31 masses. The X×MS,MW (1) Y = 2 bin corresponds to groups that have the same halo massasthewholeLGsystem(5.0×10¹²M⊙).Halomasses We split GAMA galaxy stellar masses (taken from are 100% complete for groups where 1 6Y 62. Taylor et al. 2011) into bins separated by factors of two, 2 and each bin therefore contains a mass range of ±0.15 dex. MS,MW isthereferenceMWstellarmass.Sincewearecom- plete down to MS = 1010M⊙ we define the bin centre of 6 GALAXY PROPERTY DEPENDENCIES the X = 1 bin containing the MW as 5.67×10¹⁰M⊙ (so it includes stellar mass of the MW, which we take to be 6.1 The Imperfect Relationship Between Colour, MS,MW = 5.0×10¹⁰M⊙; Flynn et al. 2006), meaning we Emission, Type & Disk haveacompletesamplewith2.5binwidthsonthelowmass Having established a set of contingencies that describe side exactly. The stellar mass range selected is 100% com- galaxies in adiscretemanner,wecan nowconstruct mosaic plete for galaxies where X > 1. 4 plotsthatrevealthemostsignificantdependencies.Combin- For reference the MW is in the X =1 bin (MS,MW = ing information in this manner will give us an insight into 5.0×10¹⁰M⊙; Flynn et al. 2006); the LMC is in the X = whatdrivesgalaxyformationingalaxieswithastellarmass 312 bin (MS,LMC = 2.3 × 10⁹M⊙; James & Ivory 2011); content similar to the MW. We can also determine which the SMC is in the X = 1218 bin (MS,MW = 5.3×10⁸M⊙; galaxy parameters are degenerate. James & Ivory 2011); M31 is in the X =2 bin (MS,M31 = Galaxypopulationsareknowntobebimodalinanum- 1.0×10¹¹M⊙;Hammer et al.2007)andM33isintheX = 81 berofproperties(seeBlanton et al.2003;Baldry et al.2004, (MS,M33 =5.7×10⁹M⊙; Verley et al. 2009). 2006;Driveret al.2006,andTayloretal.inprep).Themain ones that we can investigate here are colour, disk presence, morphological type and line emission. A simplistic descrip- 5.2.4 Halo Mass tionofextra-galacticastronomymightbracketgalaxiesinto Y ×MH,MW (2) two main classes (or dependencies): blue, disky, star form-
The list of books you might like

Mind Management, Not Time Management

Credence

The 48 Laws of Power

The Mountain Is You
Umwelt und Gesundheit

DTIC ADA448671: Religion and the Military: A Growing Ethical Dilemma
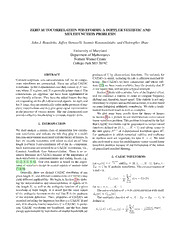
DTIC ADA476425: Zero Autocorrelation Waveforms: A Doppler Statistic and Multifunction Problems
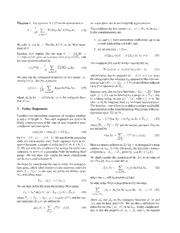
DTIC ADA475667: Finite Heisenberg-Weyl Groups and Golay Complementary Sequences

Mycotaxon 2006: Vol 95 Index
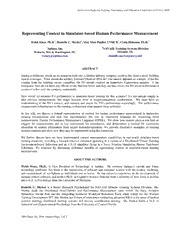
DTIC ADA473946: Representing Context in Simulator-based Human Performance Measurement
Home Science (Std11 - Tamil Medium)

Python Scripting for ArcGIS
Supersymmetry Without Prejudice

Hypoxische Gefährdung des Fetus sub partu: Klinik und neue Überwachungsverfahren
Características zoogeográficas de la ictiofauna litoral de las islas de Cabo Verde y comparación con los archipiélagos macaronésicos
Greek Government Gazette: Part 3, 2006 no. 397
Greek Government Gazette: Part 2, 1993 no. 450
DTIC ADA464547: Phonon Limited Performance of III-V Nanowire Transistors
