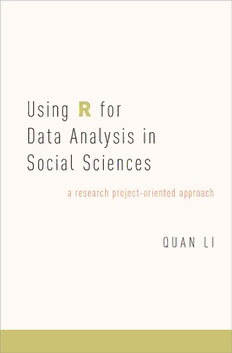
Table Of ContentUsing R for Data Analysis
in Social Sciences
Using R for Data
Analysis in
Social Sciences
AResearchProject-OrientedApproach
QUAN LI
1
1
OxfordUniversityPressisadepartmentoftheUniversityofOxford.Itfurthers
theUniversity’sobjectiveofexcellenceinresearch,scholarship,andeducation
bypublishingworldwide.OxfordisaregisteredtrademarkofOxfordUniversity
PressintheUKandincertainothercountries.
PublishedintheUnitedStatesofAmericabyOxfordUniversityPress
198MadisonAvenue,NewYork,NY10016,UnitedStatesofAmerica.
©OxfordUniversityPress2018
Allrightsreserved.Nopartofthispublicationmaybereproduced,storedin
aretrievalsystem,ortransmitted,inanyformorbyanymeans,withoutthe
priorpermissioninwritingofOxfordUniversityPress,orasexpresslypermitted
bylaw,bylicenseorundertermsagreedwiththeappropriatereproduction
rightsorganization.Inquiriesconcerningreproductionoutsidethescopeofthe
aboveshouldbesenttotheRightsDepartment,OxfordUniversityPress,atthe
addressabove.
Youmustnotcirculatethisworkinanyotherform
andyoumustimposethissameconditiononanyacquirer.
LibraryofCongressCataloging-in-PublicationData
Names:Li,Quan,1966–author.
Title:UsingRfordataanalysisinsocialsciences:aresearch
project-orientedapproach/QuanLi.
Description:NewYork,NY:OxfordUniversityPress,[2018]
Identifiers:LCCN2017010031|ISBN9780190656225(pbk.)|
ISBN9780190656218(hardcover)|ISBN9780190656232(updf)|
ISBN9780190656249(epub)Subjects:LCSH:Socialsciences–Research–Data
processing.|Socialsciences–Statisticalmethods.|R(Computerprogramlanguage)
Classification:LCCH61.3.L522018|DDC330.285/5133–dc23
LCrecordavailableathttps://lccn.loc.gov/2017010031
1 3 5 7 9 8 6 4 2
PaperbackprintedbyWebCom,Inc.,Canada
HardbackprintedbyBridgeportNationalBindery,Inc.,UnitedStatesofAmerica
CONTENTS
ListofFigures ix
ListofTables xi
Acknowledgments xiii
Introduction xv
1. LearnaboutRandWriteFirstToyPrograms
1
WHENTOUSERINARESEARCHPROJECT 2
ESSENTIALSABOUTR 3
HOWTOSTARTAPROJECTFOLDERANDWRITEOURFIRSTRPROGRAM 4
CREATE,DESCRIBE,ANDGRAPHAVECTOR:ASIMPLETOYEXAMPLE 7
SIMPLEREAL-WORLDEXAMPLE:DATAFROMIVERSENANDSOSKICE(2006) 23
CHAPTER1:RPROGRAMCODE 28
TROUBLESHOOTANDGETHELP 32
IMPORTANTREFERENCEINFORMATION:SYMBOLS,OPERATORS,ANDFUNCTIONS 34
SUMMARY 35
MISCELLANEOUSQ&ASFORAMBITIOUSREADERS 36
EXERCISES 42
2.GetDataReady:Import,Inspect,andPrepareData
43
PREPARATION 43
IMPORTPENNWORLDTABLE7.0DATASET 45
INSPECTIMPORTEDDATA 49
PREPAREDATAI:VARIABLETYPESANDINDEXING 55
PREPAREDATAII:MANAGEDATASETS 59
PREPAREDATAIII:MANAGEOBSERVATIONS 65
PREPAREDATAIV:MANAGEVARIABLES 68
contents
vi
CHAPTER2PROGRAMCODE 78
SUMMARY 85
MISCELLANEOUSQ&ASFORAMBITIOUSREADERS 86
EXERCISES 93
3.One-SampleandDifference-of-MeansTests
94
CONCEPTUALPREPARATION 95
DATAPREPARATION 101
WHATISTHEAVERAGEECONOMICGROWTHRATEINTHE WORLDECONOMY? 104
DIDTHEWORLDECONOMYGROWMOREQUICKLYIN 1990THANIN1960? 115
CHAPTER3PROGRAMCODE 128
SUMMARY 133
MISCELLANEOUSQ&ASFORAMBITIOUSREADERS 133
EXERCISES 142
4.CovarianceandCorrelation
143
DATAANDSOFTWAREPREPARATIONS 143
VISUALIZETHERELATIONSHIPBETWEENTRADEANDGROWTH USING
SCATTERPLOT 146
ARETRADEOPENNESSANDECONOMICGROWTHCORRELATED? 149
DOESTHECORRELATIONBETWEENTRADEANDGROWTHCHANGE OVERTIME? 154
CHAPTER4PROGRAMCODE 160
SUMMARY 163
MISCELLANEOUSQ&ASFORAMBITIOUSREADERS 164
EXERCISES 168
5.RegressionAnalysis
170
CONCEPTUALPREPARATION:HOWTOUNDERSTANDREGRESSIONANALYSIS 171
DATAPREPARATION 175
VISUALIZEANDINSPECTDATA 182
HOWTOESTIMATEANDINTERPRETOLSMODELCOEFFICIENTS 185
HOWTOESTIMATESTANDARDERROROFCOEFFICIENT 187
HOWTOMAKEANINFERENCEABOUTTHEPOPULATION PARAMETER
OFINTEREST 188
HOWTOINTERPRETOVERALLMODELFIT 190
HOWTOPRESENTSTATISTICALRESULTS 193
CHAPTER5PROGRAMCODE 194
SUMMARY 198
contents
vii
MISCELLANEOUSQ&ASFORAMBITIOUSREADERS 199
EXERCISES 204
6.RegressionDiagnosticsandSensitivityAnalysis
206
WHYAREOLSASSUMPTIONSANDDIAGNOSTICSIMPORTANT? 206
DATAPREPARATION 211
LINEARITYANDMODELSPECIFICATION 215
PERFECTANDHIGHMULTICOLLINEARITY 221
CONSTANTERRORVARIANCE 223
INDEPENDENCEOFERRORTERMOBSERVATIONS 227
INFLUENTIALOBSERVATIONS 240
NORMALITYTEST 245
REPORTFINDINGS 247
CHAPTER6PROGRAMCODE 251
SUMMARY 259
MISCELLANEOUSQ&ASFORAMBITIOUSREADERS 259
EXERCISES 262
7.ReplicationofFindingsinPublishedAnalyses
263
WHATEXPLAINSTHEGEOGRAPHICSPREADOFMILITARIZEDINTERSTATEDISPUTES?
REPLICATIONANDDIAGNOSTICSOFBRAITHWAITE(2006) 264
DOESRELIGIOSITYINFLUENCEINDIVIDUALATTITUDESTOWARDINNOVATION?
REPLICATIONOFBÉNABOUETAL.(2015) 284
CHAPTER7PROGRAMCODE 295
SUMMARY 301
8.Appendix:ABriefIntroductiontoAnalyzingCategorical
DataandFindingMoreData
302
OBJECTIVE 302
GETTINGDATAREADY 303
DOMENANDWOMENDIFFERINSELF-REPORTEDHAPPINESS? 304
DOBELIEVERSINGODANDNON-BELIEVERSDIFFERINSELF-REPORTED
HAPPINESS? 310
SOURCESOFSELF-REPORTEDHAPPINESS:LOGISTICREGRESSION 313
WHERETOFINDMOREDATA 323
ReferencesandReadings 327
Index 331
LIST OF FIGURES
1.1 HowtoWriteFirstToyPrograminR 8
1.2 HowtoInstallAdd-onPackage 18
1.3 DistributionofDiscreteVariablevd$v1:BarChart 21
1.4 DistributionofContinuousVariablevd$v1:Boxplotand
Histogram 23
1.5 DistributionofWageInequalityfromIversenand
Soskice(2006) 27
1.6 DistributionofPRandMajoritarianSystemsfromIversenand
Soskice(2006) 27
1.7 RStudioScreenshot 38
2.1 UsingView()FunctiontoViewRawData 50
2.2 DistributionofVariablergdpl 55
3.1 TypesofErrorsandAlternativeSamplingDistributions 100
3.2 HistogramforGrowth 113
3.3 Meanand95%ConfidenceIntervalforGrowth 114
3.4 Meanand95%ConfidenceIntervalforGrowth:1960and1990 127
4.1 SimulatedPositiveCorrelationsofTwoRandomVariables 147
4.2 ScatterPlotofTradeOpennessandEconomicGrowth 148
4.3 CorrelationbetweenTradeandGrowthoverTime 157
4.4 PValueofCorrelationbetweenTradeandGrowthoverTime 159
4.5 AnscombeQuartetScatterPlot 166
5.1 OriginalStatisticalResultsfromFrankelandRomer(1999) 174
5.2 ComparingUnloggedandLoggedIncomeperPerson 184
5.3 TradeOpennessandLogofIncomeperPerson 184
5.4 CoefficientsPlotforModel1 194
5.5 PartialRegressionPlot 203
5.6 ExplorePairwiseRelationshipsamongVariables 204
6.1 AnscombeQuartetRegressions 210
6.2 AnscombeQuartetResidualsversusFittedValuesPlots 211

