Table Of ContentNEW HAMPSHIRE TURNPIKE SYSTEM
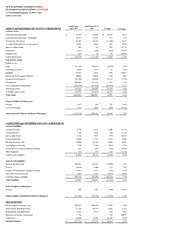
STATEMENT OF NET POSITION UNAUDITED
For Period Ended January 31, 2017 v. 2016
(Dollars in Thousands)
Period Ended Period Ended Jan 31
ASSETS and DEFERRED OUTFLOWS of RESOURCES Jan 31 2017 2016 $ Change % Change
Current Assets:
Cash and Cash Equivalents $ 94,300 $ 68,965 $ 25,335 36.7%
Cash and Cash Equivalents – Restricted 49,053 48,241 812 1.7%
Investments - Restricted 30,377 46,317 (15,940) -34.4%
Accounts Receivable (Net of Allowances) 6,492 5,669 823 14.5%
Due from Other Funds 503 212 291 137.3%
Inventories 1,412 1,828 (416) -22.8%
Prepaid Assets 133 36 97 269.4%
Total Current Assets 182,270 171,268 11,002 6.4%
Non-current Assets:
Capital Assets:
Land 101,409 103,679 (2,270) -2.2%
Land Improvements 2,003 1,972 31 1.6%
Buildings 14,459 6,613 7,846 118.6%
Equipment and Computer Software 50,862 48,608 2,254 4.6%
Construction in Progress 162,598 144,484 18,114 12.5%
Infrastructure 962,900 951,167 11,733 1.2%
Less: Accumulated Depreciation (383,438) (361,504) (21,934) 6.1%
Net Capital Assets 910,793 895,019 15,774 1.8%
Total Non-current Assets 910,793 895,019 15,774 1.8%
Total Assets 1,093,063 1,066,287 26,776 2.5%
Deferred Outflows of Resources:
Pension 1,127 830 1 297 35.8%
Loss on Refunding 1,539 2,005 (466) -23.2%
Total Assets and Deferred Outflows of Resources 1,095,729 1,069,122 26,607 2.5%
LIABILITIES and DEFERRED INFLOWS of RESOURCES
Current Liabilities:
Accounts Payable 9,700 6,012 3,688 61.3%
Accrued Payroll 1,300 1,022 278 27.2%
Due to Other Funds 1,106 2,015 (909) -45.1%
Unearned Revenue 15,096 11,721 3,375 28.8%
Revenue Bonds Payable 28,080 19,120 8,960 46.9%
Accrued Interest Payable 7,298 7,660 (362) -4.7%
Claims and Compensated Absences Payable 293 422 (129) -30.6%
Other Liabilities 326 179 147 82.1%
Total Current Liabilities 63,199 48,151 15,048 31.3%
Non-current Liabilities:
Revenue Bonds Payable 395,091 426,019 (30,928) -7.3%
Pension 10,100 9,369 731 7.8%
Claims and Compensated Absences Payable 1,943 2,273 (330) -14.5%
Other Non-current Liabilities 2,568 4,205 (1,637) -38.9%
Total Non-current Liabilities 409,702 441,866 (32,164) -7.3%
Total Liabilities 472,901 490,017 (17,116) -3.5%
Deferred Inflows of Resources:
Pension 607 1,367 (760) -55.6%
Total Liabilities and Deferred Inflows of Resources 473,508 491,384 (17,876) -3.6%
NET POSITION
Net Investment in Capital Assets 493,918 480,659 13,259 2.8%
Restricted for Debt Repayments 71,154 62,773 8,381 13.4%
Restricted for Uninsured Risks 3,421 3,011 410 13.6%
Restricted for Facility Sustainment 98 - 98 100.0%
Unrestricted 53,630 31,295 22,335 71.4%
Total Net Position $ 622,221 $ 577,738 $ 44,483 7.7%
NEW HAMPSHIRE TURNPIKE SYSTEM
STATEMENT OF REVENUES, EXPENSES AND CHANGES IN NET POSITION - UNAUDITED
Compare Month and Year-to-Date Ended January 31, 2017 v. 2016
(Dollars in Thousands)
FY 2017 FY 2016 FY 2017 FY 2016
Month Ended Month Ended Year-to-Date Year-to-Date
Jan 31 2017 Jan 31 2016 $ Change % Change Jan 31 2017 Jan 31 2016 $ Change % Change
OPERATING REVENUES
Toll Revenue - Cash $ 2,018 $ 2,217 $ (199) -9.0% $ 20,222 $ 21,461 $ (1,239) -5.8%
Toll Revenue - E-ZPass 7 ,169 6 ,733 436 6.5% 5 7,813 54,733 3,080 5.6%
Other Toll Operating Revenue (Net of Allowances) 446 2 31 215 93.1% 2 ,211 1,423 788 55.4%
Transponder Revenue 69 54 15 27.8% 541 750 ( 209) -27.9%
Federal Revenue - - - 0.0% - 14 (14) -100.0%
Total Operating Revenues 9 ,702 9 ,235 467 5.1% 8 0,787 78,381 2,406 3.1%
OPERATING EXPENSES
Personnel Services 949 8 50 1 99 11.6% 5 ,974 5,544 1 430 7.8%
Payroll Benefits 498 4 45 1,2 53 11.9% 3 ,248 3,106 1,2 142 4.6%
Enforcement 626 5 34 2 92 17.2% 4 ,570 4,160 2 410 9.9%
Renewal & Replacement 122 1 23 ( 1) -0.8% 7 ,647 3,269 4,378 133.9%
Supplies, Materials and Other 370 3 35 1,2 35 10.4% 1 ,635 1,400 1 235 16.8%
Equipment and Repairs 419 4 86 1 ( 67) -13.8% 2 ,472 2,131 1 341 16.0%
Indirect Costs 197 2 01 ( 4) -2.0% 1 ,376 1,398 ( 22) -1.6%
Welcome Centers 63 63 1 - 0.0% 433 468 1 (35) -7.5%
Heat, Light and Power 97 98 1 (1) -1.0% 584 504 1 80 15.9%
Bank and Credit Card Fees 198 1 74 1 24 13.8% 1 ,612 1,501 111 7.4%
Rentals 176 1 21 55 45.5% 417 271 146 53.9%
E-ZPass Processing Fees 634 5 44 90 16.5% 4 ,453 4,061 392 9.7%
Transponder Expense 59 49 10 20.4% 484 737 ( 253) -34.3%
Depreciation and Amortization 1 ,840 1 ,782 58 3.3% 1 2,878 12,490 388 3.1%
Total Operating Expenses 6 ,248 5 ,805 443 7.6% 4 7,783 41,040 6,743 16.4%
Operating Income 3 ,454 3 ,430 24 0.7% 3 3,004 37,341 (4,337) -11.6%
NON-OPERATING REVENUES (EXPENSES)
Investment Income 30 60 ( 30) -50.0% 195 727 ( 532) -73.2%
Welcome Center Revenue 74 42 32 76.2% 461 292 169 57.9%
Miscellaneous Income 261 244 17 7.0% 2 ,034 1,862 172 9.2%
Gain on the Sale of Other Capital Assets - - - 0.0% - 6 (6) -100.0%
Interest on Bonds and Note (1,051) (1,250) 199 -15.9% (7,896) (9,310) 1,414 -15.2%
Miscellaneous Expense (1) - 1 (1) 100.0% (28) (53) 25 -47.2%
Total Non-operating Revenues (Expenses) (687) (904) 217 -24.0% (5,234) (6,476) 1,242 -19.2%
Change in Net Position Before Capital Contributions 2 ,767 2 ,526 241 9.5% 2 7,770 30,865 (3,095) -10.0%
Capital Contributions - 3 ( 3) -100.0% - 6 (6) -100.0%
Change in Net Position 2 ,767 2 ,529 238 9.4% 2 7,770 30,871 (3,101) -10.0%
Net Position -January 1/ July 1 619,454 575,209 44,245 7.7% 594,451 546,867 47,584 8.7%
Net Position -January 31 $ 622,221 $ 577,738 44,483 7.7% $ 622,221 577,738 $ 44,483 7.7%
1 Restated for Comparative Purposes - DRED expenses moved to Welcome Centers.
2 Restated for Comparative Purposes - Safety AU 8014 reclassed to Enforcement.

