Family economics and nutrition review PDF
Preview Family economics and nutrition review
Historic, Archive Document Do not assume content reflects current scientific knowledge, policies, or practices. amily Economics and Nutrition Review Volume 15, Number 2 2003 Research Articles Nutrient Intakes Among Dietary Supplement Users and Nonusers in the Food Stamp Population Jennifer Sheldon and David L. Pelletier Trends in Food and Nutrient Intakes by Adolescents in the United States Cecilia Wilkinson Enns, Sharon J. Mickle, and Joseph D. Goldman Research Brief Food Security, Dietary Choices, and Television-Viewing Status of Preschool-Aged Children Living in Single-Parent or Two-Parent Households Shanthy A. Bowman and Ellen W. Harris Center Reports Expenditures on Children by Families, 2002 Mark Lino Revision of USDA's Low-Cost, Moderate-Cost, and Liberal Food Plans Andrea Carlson, Mark Lino, Shirley Gerrior, and P. Peter Basiotis Insight 25: Report Card on the Diet Quality of Children Ages 2 to 9 Andrea Carlson, Mark Lino, Shirley Gerrior, and P Peter Basiotis Insight 26: Food Insufficiency and Prevalence of Overweight Among Adult Women P Peter Basiotis and Mark Lino Federal Studies • Journal Abstracts • Food Plans • Consumer Prices • Poverty Thresholds V * Ann M. Veneman, Secretary U.S. Department of Agriculture Eric M. Bost, Under Secretary Food, Nutrition, and Consumer Services Eric J. Hentges, Executive Director Center for Nutrition Policy and Promotion Steven N. Christensen, Deputy Director Center for Nutrition Policy and Promotion P. Peter Basiotis, Director Nutrition Policy and Analysis Staff Center for Nutrition Policy and Promotion Mission Statement To improve the health of Americans by developing and promoting dietary guidance that links scientific research to the nutrition needs of consumers. The U.S. Department of Agriculture (USDA) prohibits discrimination in all its programs and activities on the basis of race, color, national origin, sex, religion, age, disability, political beliefs, sexual orientation, or marital or family status. (Not all prohibited bases apply to all programs.) Persons with disabilities who require alternative means for communication of program informa¬ tion (Braille, large print, audiotape, etc.) should contact USDA’s TARGET Center at (202) 720-2600 (voice and TDD). To file a complaint of discrimination, write USDA, Director. Office of Civil Rights, Room 326-W, Whitten Building, 14th and Independence Avenue, SW, Washington, DC 20250- 9410 or call (202) 720-5964 (voice and TDD). USDA is an equal opportunity provider and employer. CENTER FOR NUTRITION POLICY AND PROMOTION Editor Research Articles Julia M. Dinkins Associate Editor 3 Nutrient Intakes Among Dietary Supplement Users and Nonusers David M. Herring in the Food Stamp Population Jennifer Sheldon and David L. Pelletier Managing Editor JaneW. Fleming 15 Trends in Food and Nutrient Intakes by Adolescents in the United States Features Editor Mark Lino Cecilia Wilkinson Enns, Sharon J. Mickle, and Joseph D. Goldman Peer Review Coordinator Hazel Hiza Research Brief Family Economics and Nutrition Review is 29 Food Security, Dietary Choices, and Television-Viewing Status of Preschool-Aged Children published semiannually by the Center for Living in Single-Parent or Two-Parent Households Nutrition Policy and Promotion, U.S. Department ShanthyA. Bowman and Ellen W. Harris of Agriculture, Washington, DC. The Secretary of Agriculture has determined that publication of this periodical is necessary in the Center Reports transaction of the public business required by law of the Department. 35 Expenditures on Children by Families, 2002 This publication is not copyrighted. Thus, Mark Lino contents may be reprinted without permission, 43 Revision of USDA’s Low-Cost, Moderate-Cost, and Liberal Food Plans but credit to Family Economics and Nutrition Review would be appreciated. Use of Andrea Carlson, Mark Lino, Shirley Gerrior, and P Peter Basiotis commercial or trade names does not imply 52 Insight 25: Report Card on the Diet Quality of Children Ages 2 to 9 approval or constitute endorsement by USDA. Family Economics and Nutrition Review is Andrea Carlson, Mark Lino, Shirley Gerrior, and P. Peter Basiotis indexed in the following databases: AGRICOLA, 55 Insight 26: Food Insufficiency and Prevalence of Overweight Among Adult Women Ageline, Economic Literature Index, ERIC, Family Studies, PAIS, and Sociological P Peter Basiotis and Mark Lino Abstracts. Family Economics and Nutrition Review is for sale by the Superintendent of Documents. Subscription price is $13 per year ($18.20 for foreign addresses). Send subscription order 58 Federal Studies and change of address to Superintendent of 66 Journal Abstracts Documents, PO. Box 371954, Pittsburgh, PA 15250-7954. (See subscription form on p. 72.) 68 Official USDA Food Plans: Cost of Food at Home at Four Levels, U.S. Average, December 2003 Original manuscripts are accepted for publication. (See “guidelines for submissions" 69 Consumer Prices on back inside cover.) Suggestions or 70 U.S. Poverty Thresholds and Related Statistics comments concerning this publication should be addressed to Julia M. Dinkins, Editor, 71 Reviewers of Manuscripts for the 2003 Issues Family Economics and Nutrition Review, Center for Nutrition Policy and Promotion, USDA, 3101 Park Center Drive, Room 1034, Alexandria, VA 22302-1594. Family Economics and Nutrition Review Volume 15, Number 2 is now available at www.cnpp.usda.gov. 2003 Front and Center T he Center for Nutrition Policy and Promotion continues to link nutrition science to the nutrition needs of consumers. This issue of Family Economics and Nutrition Review provides the science on the associations between nutrient intakes and dietary status of several segments of the U.S. population: dietary supplement users and nonusers in the food stamp population, adolescents, and preschool-aged children. Understanding the associations among supplement use. nutrient densities, and diet quality among subgroups within a population informs policy. A long-term portrait of the intakes among U.S. adolescents leads to recommendations regarding the intake of grains, vegetables, fruits, legumes, lean meats, dairy products, dietary fat, physical activity levels, and effective nutrition education. A comparison among household types in which preschool-aged children reside highlights the continuing need to address issues of food security, energy (kcal) consumption, and sedentary activities that may place children at higher risks of being overweight or obese. In addition to Family Economics and Nutrition Review, the Center uses a series of bulletins to inform consumers of the connection between dietary guidance and nutritional well-being. In its latest issue of the bulletin Putting the Guidelines into Practice, the Center suggests ways that consumers can "Get moving . . . For the health and fun of it!” This bulletin helps consumers understand the benefits of physical activity, how much is needed, and how to incorporate it into a busy lifestyle. With its online dietary assessment tool—the Interactive Healthy Eating Index (IHEI)—the Center provides an opportunity for consumers to input their daily food intakes and then receive a quick summary measure of the quality of their diets. With USDA's release of the Interactive Physical Activity Tool (IPAT) this past December, the Center combined two important aspects of healthful living: appropriate dietary intake and physical activity. An enhancement to the IHEI. the IPAT allows users to input their daily activities and receive a physical activity score m terms of current recommendations. In combination, the IHEI and the IPAT allow users to receive prompt, accurate, and up-to-date information on diet quality and physical activity status. From the research of Family Economics and Nutrition Review to the information of the consumer bulletins to the interactive feedback of the complementary Web-based IHEI and IPAT. the Center's mission remains focused on helping consumers link dietary guidance to lifelong dietary behaviors that can enhance their well-being. Eric J. Hentges, PhD Executive Director Center for Nutrition Policy and Promotion Research Articles Nutrient Intakes Among Dietary Supplement Users and Nonusers in the Food Stamp Population Jennifer Sheldon, BS This study characterized the nutrient intakes of participants in the Food Stamp David L. Pelletier, PhD Program (FSP) who used nutrient supplements, compared with those who did not, and examined the variation in these relationships across different socio¬ Cornell University demographic subgroups. Dietary intakes from food sources for eight key nutrients were examined from the 1994-96 Continuing Survey of Food Intakes by Individuals. Two measures of overall diet quality were also included in the analysis. Findings revealed that supplement use in FSP participants was positively associated with nutrient densities for iron, calcium, fiber, folate, vitamin A, and vitamin C and with overall diet quality. However, the direction and magnitude of this association varied across age, gender, and ethnic groups for iron, saturated fat, fiber, vitamin A, and one measure of overall diet quality (Z-score). Thus, results show that supplement use is not uniformly associated with more healthful diets among FSP participants. T he U.S. marketplace for dietary that are perceived or marketed as supplements is large and having links to improved health, changing rapidly. National performance, or well-being (Heasman surveys indicate that dietary supple¬ & Mellentin, 2001). The U.S. market ments are used by roughly 50 percent for functional foods is estimated to of the U.S. population (Balluz, rise from about $20 billion in 2000 Kieszak, Philen, & Mulinare, 2000; to $50 billion by 2010 (Government Slesinsky, Subar, & Kahle, 1995). Accounting Office [GAO], 2000). Industry sources suggest that sales of all forms of supplements combined— The rapid rise and high prevalence of including nutrients, herbals, sports supplement use in the United States products, and meal supplements—rose stand in marked contrast to the views from $8.6 billion in 1994 to $16 billion and positions of professional and in 2000 (Heasman & Mellentin. 2001). scientific nutrition communities. During that same period, sales of Organizations such as the American nutrient supplements, specifically, Dietetic Association (ADA) (Hunt, rose from $3.9 billion to $6.1 billion. 1996), the Dietary Guidelines for This rise in consumption of dietary Americans Advisory Committee (U.S. supplements is only the beginning Department of Agriculture [USDA] & of a much larger “functional foods U.S. Department of Health and Human revolution" built upon the development Services [DHHS], 2000), and the and marketing of a wide variety of Food and Nutrition Board of the supplements, genetically engineered Institute of Medicine (IOM, 1994) foods, fortified foods, and conventional have maintained that most individuals foods with compositional properties can and should obtain all necessary 2003 Vol. 15 No. 2 3 nutrients in adequate amounts from a two other issues. One is their low or attitudinal characteristics (Pelletier varied diet and that supplements are efficacy in individuals and populations & Kendall. 1997). needed only in special circumstances. that do not suffer from nutrient The position of the ADA regarding deficiencies (USDA. 1999). In such The present study was initiated within supplementation is that cases, the exaggerated marketing the context of a rapidly expanding claims regarding their benefits may dietary supplement industry, a per¬ the best nutritional strategy for mislead some consumers. While most missive set of laws and regulations, promoting optimal health and studies show that supplement use is continued uncertainty regarding safety reducing the risk of chronic more common among Whites, women, and efficacy, and questions concerning disease is to obtain adequate those with higher levels of education, the positive or negative relationships nutrients from a wide variety and those with higher incomes (USDA, between supplement use and the of foods. Vitamin and mineral 1999; Koplan, Annest, Layde. & quality of food intake. The specific supplementation is appropriate Rubin, 1986; Lyle, Mares-Perlman, motivation for the study was the when well-accepted, peer- Klein, Klein, & Greger. 1998; proposal considered by Congress on reviewed, scientific evidence Pelletier & Kendall, 1997), usage numerous occasions in the last decade shows safety and effectiveness. is not restricted to those groups. For to permit the use of food stamps to (Hunt, 1996, p. 73) instance, analysis of the 1994-95 purchase nutrient supplements. This Continuing Survey of Food Intakes proposal was included in a House bill Notwithstanding the views of the ADA. by Individuals (CSFII) reveals that leading up to the welfare reform effort the Food and Drug Administration supplements were used by 49 percent in 1996 (H R. 104-236) and more (FDA), and other professional and of higher income individuals (greater recently in a Senate bill (S.1731) scientific bodies. Congress created than 130 percent of the poverty line) leading up to the 2002 Larm bill. The the Dietary Supplement Health and and 36 percent of lower income proposal has yet to be incorporated Education Act in 1994 that has little individuals (USDA, 1999). into legislation on these and other or no requirement for manufacturers occasions. to demonstrate the safety and efficacy The second issue related to nutrient of dietary supplements and is more supplements is whether they are used An expert committee of the Life permissive than conventional foods as true supplements for an already Sciences Research Office (LSRO, regarding the claims that marketers healthful diet or as a substitute for 1998) and the USDA (1999) raised can make about the benefits of these such a diet. This is important because a number of concerns regarding this products. In a recent report, the of the wide range of health-promoting proposal, including evidence that GAO (2000) concluded that the substances contained in whole foods, nutrient intakes of ESP participants compared with supplements, which are similar to those of the general FDA's efforts and federal laws still are far from being understood population, that most ESP participants provide limited assurances of fully. Most studies have shown that can and do purchase supplements with the safety of functional foods supplement users, compared with income other than food stamps, and and dietary supplements nonusers, tend to have higher vitamin that administrative complications asso¬ [and] ... we also found that and mineral intakes from food (Koplan ciated with the proposed change are agencies' efforts and federal et al., 1986; Looker, Sempos, Johnson, considerable. In addition, the LSRO laws concerning health-related & Yetley, 1998; Lyle et al., 1995). report noted a lack of research-based claims on product labels and suggesting a supplementing effect information concerning the relationship in advertising provide limited rather than a substitutive effect. Those between supplement use and dietary assistance to consumers in studies have, however, assumed that intake among ESP participants. making informed choices and such a finding applies equally to do little to protect them against all consumers. The one study that This study examined the associations misleading and inaccurate examined potential heterogeneity in between supplement use and nutrient claims, (pp. 4-5) that relationship revealed that supple¬ intakes from food among PSP partici¬ ment use is associated with more pants, as well as the extent to which While nutrient supplements taken in healthful food intakes in some popu¬ these associations are uniform across moderation do not raise the same safety lation groups but also is associated all sociodemographic subgroups of the concerns as do herbals and other with less healthful food intakes in other FSP population. dietary supplements, they do raise groups defined by sociodemographic Family Economics and Nutrition Review assumption that data are normally of the HEI has a maximum score of Methods distributed, which is implicit in many 10 and a minimum score of 0. High standard statistical tests such as the component scores indicate intakes Data and Sample r and F tests as used in the present close to recommended ranges or The data used in this study were analysis, various transformations were amounts; low component scores, less derived from the 1994-96 CSFII. The used to ensure that individual nutrient compliance. The present analysis used CSFII, a national survey of dietary data represented a normal distribution. the five Food Guide Pyramid com¬ intake conducted by the USDA, is A square root was used to transform ponents of the HEI. which reflect weighted to reflect a nationally fiber and vitamin C intakes while a how well each person incorporated representative sample of noninstitu- natural log transformation was applied the desirable number of servings from tionalized persons living in the United to folate, calcium, iron, and vitamin A. each of the five food groups on the States (Tippett. Enns, & Moshfegh, Because total fat and saturated fat data recalled day. These five components 1999). The present study examined were normally distributed, they were were averaged together to achieve the first recalled day for the 16.103 not transformed. a mean value for each person. It is respondents who provided at least important to note that unlike the Z- 1 day of dietary data. The focus of In addition to the eight individual score index, the HEI was not adjusted this research was on nutrient intake nutrient density variables, we included for energy intake or the quantity of exclusively from food sources. As two additional variables in the regres¬ food intake on the day of the recall. defined by the 1994-96 CSFII. food sion to test the overall quality of each intake does not include vitamins, respondent’s diet. An average diet Sociodemographic variables consisted minerals, or other supplements. Thus, score (index) was calculated from of age, gender, education, employment the nutrient intakes analyzed here the Z-score values of the eight key status, and ethnicity. Ethnicity was reflect these caveats. nutrients. This average Z-score reflects coded as non-Hispanic Whites the quality of the diet with respect to (“Whites"), non-Hispanic Blacks Only 9,468 records were used in this these key nutrients and. as such, may (“Blacks"), and anyone reporting analysis. The respondents excluded provide different information than any Hispanic origin (“Hispanic"). The from the analysis were less than 18 single nutrient considered alone. By reference (omitted) groups in the years old; other than Hispanic, Black, using the full dataset of 9,468 individ¬ regression analyses were 50 years and or White; and had missing records or uals that included FSP participants older (age), female (gender), less than erroneous data. For the final sample, and nonparticipants, we were able to high school (education), unemployed 886 were FSP participants and 8,582 calculate average intake values that (employment status), and White were FSP nonparticipants. were representative of the entire U.S. (ethnicity). population. Subsequently, intake Variables and Transformations values of smaller subgroups could Nutrient supplement use was defined be compared with those of the whole based on the response to this question: Much of the methodology used in population. The sign of the Z-score “How often, if at all, do you take any this study followed very closely the was reversed for total and saturated fat, vitamin supplement in pill or liquid methods of an earlier study by Pelletier prior to summing across all nutrients, form?" Because of sample size con¬ and Kendall (1997). The dietary data to maintain consistency in the siderations, we defined users as those used in this analysis were based on a interpretation of this index. reporting the use of any type of supple¬ single 24-hour recall for each partici¬ ment “every day or almost every day" pant. To account for differences in Another computed variable used to or “every so often," and we defined total energy intake, we used the 1 -day measure overall diet quality was the nonusers (the reference group) as dietary recall nutrient data for the eight Healthy Eating Index (HEI). The HEI those reporting "not at all." key nutrients (total fat, saturated fat. was developed by the USDA's Center iron, calcium, fiber, folate, vitamin A, for Nutrition Policy and Promotion to Data Analysis and vitamin C), which were expressed in proportion to total kilocalories assess and monitor the dietary status The relationships among dietary intake, consumed and are referred to here as of Americans in accordance with the supplement use, and sociodemographic nutrient densities. Such nutrient indices Food Guide Pyramid and the Dietary characteristics in the population of FSP are more indicative of overall diet Guidelines for Americans (Variyam, participants were examined by using quality and make comparison among Blaylock. Smallwood, & Basiotis, multiple regressions. 1998). Each of the 10 components records easier. Because of the 2003 Vol. 15 No. 2 5 Table 1. Supplement use based on the various sociodemographic characteristics of the U.S. population, CSFI11994-96 Non-food stamp Food stamp Total sample recipients recipients Variable (n = 9,468) (n = 8,582) (n = 886) Percent users1 Ethnicity White 51 52 40 ... among FSP nonparticipants, Black 37 39 32 Hispanic 41 43 29 supplement use was more Gender common among Whites, women, Female 55 57 41 persons 50 years and older, and Male 42 43 26 Age those with a college degree or 18-49 years 47 48 43 more. 50 years and older 52 53 33 Education Less than high school 36 37 32 High school or some college 48 49 35 College degree or more 59 59 55 Employment status Unemployed 48 49 35 Employed 49 51 36 'Percentages are weighted. Some percentages may not total to 100 because of rounding. • Main-effects models tested use and ethnicity, gender, and age whether the (generally) positive after controlling for the above- association between supplement mentioned variables. These use and dietary intake could analyses included models with be accounted for by socio¬ only 2-way interaction terms and. demographic variables. Each in separate runs, models with both nutrient and the two measures of 2-way and 3-way interaction overall dietary quality were used terms. as a dependent variable in its own model, and the association of These statistical methods were supplement use to the dependent designed to permit a valid test of the variable was observed before hypothesis that the strength or direction and after adjusting for the set of the association between supplement of sociodemographic variables use and nutrient density from food (ethnicity, gender, age. education, among FSP participants is uniform and employment status). across groups defined by socio¬ demographic characteristics. In this • Interaction models tested whether study, such a test was obtained by comparing the proportion of variance the strength or direction of the explained by either the 2-way model association was uniform across versus the main-effects model, the full ethnicity, gender, and age while 3-way model versus the main-effects controlling for education and model, or the full 3-way model versus employment status. This was the 2-way model. Because the table of accomplished by testing the model coefficients is difficult to significance of an entire block of interpret in the presence of higher interactions between supplement 6 Family Economics and Nutrition Review
The list of books you might like

Rich Dad Poor Dad

A Thousand Boy Kisses

The Silent Patient

Do Epic Shit
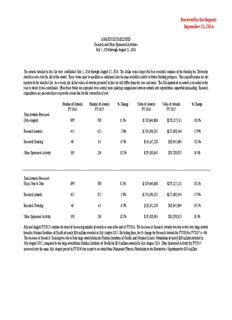
Awards Established, July 1, 2016-August 31, 2016

Anecdotes of the Great War by Carleton Britton Case

Belgians Under the German Eagle by Jean Massart
DTIC ADA440730: Ghoulality in War. The Application of Liddell Hart in Desert Storm

C. L. R. James La vie révolutionnaire d’un "Platon noir"

Tafsir Al-Azhar 7
appropriations committee

Tutte le opere. Vol. 1
Archief van Het Amsterdams Lyceum

Cabe ao Estado instruir os indivíduos quanto aos

MOHELA Annual Report 2008
Change 2006: Vol 38 Index & Table of Contents
Di-jet Shape Modification in Heavy Ion Collisions
DTIC ADA515189: Preliminary Rotary Wing Full Spectrum Crashworthiness Criteria

CAFE BAR

Arms and Armor in Africa

