Effects of Testing Time on Anaerobic Toxicity Assessment PDF
Preview Effects of Testing Time on Anaerobic Toxicity Assessment
UUnniivveerrssiittyy ooff AArrkkaannssaass,, FFaayyeetttteevviillllee SScchhoollaarrWWoorrkkss@@UUAARRKK Graduate Theses and Dissertations 8-2012 EEffffeeccttss ooff TTeessttiinngg TTiimmee oonn AAnnaaeerroobbiicc TTooxxiicciittyy AAsssseessssmmeenntt Omolola Atinuke Akintomide University of Arkansas, Fayetteville Follow this and additional works at: https://scholarworks.uark.edu/etd Part of the Civil Engineering Commons, Environmental Engineering Commons, and the Water Resource Management Commons CCiittaattiioonn Akintomide, O. A. (2012). Effects of Testing Time on Anaerobic Toxicity Assessment. Graduate Theses and Dissertations Retrieved from https://scholarworks.uark.edu/etd/446 This Thesis is brought to you for free and open access by ScholarWorks@UARK. It has been accepted for inclusion in Graduate Theses and Dissertations by an authorized administrator of ScholarWorks@UARK. For more information, please contact scholar@uark.edu. EFFECTS OF TESTING TIME ON ANAEROBIC TOXICITY ASSESSMENT EFFECTS OF TESTING TIME ON ANAEROBIC TOXICITY ASSESSMENT A thesis submitted in partial fulfillment of the requirements for the degree of Master of Science in Environmental Engineering By Omolola Atinuke Akintomide Obafemi Awolowo University Bachelor of Science in Civil Engineering, 2007 August 2012 University of Arkansas ABSTRACT Anaerobic digestion has been widely used for wastewater treatment for decades. Several Anaerobic Toxicity tests have been developed to screen wastewater for toxicity and assess the treatability of such toxicants. However, past research and reviews on Biochemical Methane Potential (BMP) test and Anaerobic Toxicity Assay (ATA) were considered in this study. The experimental tests included ammonium-nitrogen and sodium chloride toxicity tests with varied concentration and solid retention time. These tests were designed to demonstrate the impact of ammonia- nitrogen and sodium chloride on the biological degradation process. The anaerobic test set-up includes bench-scale test reactors and respirometers used for measuring gas production volume and rate. The experimental data using the gas production volumes and rates were plotted and analyzed. The hourly rate of gas production significantly decreases before the daily production volume decreases. Also, the gas production volume curves showed little or no toxicity when the gas production rates showed toxicity and acclimation. In conclusion, the hourly production rate curves will indicate toxicity faster and extensively than the cumulative daily production volumes curves, thereby reducing testing time. This thesis is approved for recommendation to the Graduate Council. Thesis Director: __________________________________ Dr. Wen Zhang Thesis Committee: __________________________________ Dr. James Young __________________________________ Dr. Findlay Edwards THESIS DUPLICATION RELEASE I hereby authorize the University of Arkansas Libraries to duplicate this thesis when needed for research and/or scholarship. Agreed __________________________ Omolola Atinuke Akintomide Refused _________________________ Omolola Atinuke Akintomide ACKNOWLEDGMENTS Special thanks to the management and staff of Envitreat LLC for funding this entire research project. Also, special thanks go out to my thesis director and committee. DEDICATION This thesis is dedicated to my family and friends for their encouragement, financial and emotional support, and to Dr. Young and Anne at the laboratory for their technical support and help in the completion of this project. TABLE OF CONTENTS LIST OF TABLES LIST OF FIGURES 1.0 INTRODUCTION .............................................................................................................. 1 2.0 LITERATURE REVIEW ................................................................................................... 3 2.1 ANAEROBIC DIGESTION ............................................................................................... 3 2.2 ANAEROBIC TOXICITY ASSESSMENT ....................................................................... 5 2.2.1 ANAEROBIC TOXICITY ASSAY (ATA) ............................................................. 6 2.2.2 BIOCHEMICAL METHANE POTENTIAL (BMP) TEST ................................... 7 2.2.3 DIFFERENCES AND SIMILARITIES BETWEEN BMP AND ATA ................... 9 2.3 FACTORS AFFECTING ANAEROBIC TOXICITY ASSESSMENT .......................... 10 2.3.1 INOCULUM/BIOMASS INVENTORY ................................................................ 11 2.3.2 TEMPERATURE ................................................................................................... 11 2.3.3 LOADING RATE ................................................................................................... 12 2.3.4 ACCLIMATION..................................................................................................... 13 2.3.5 OTHER FACTORS ................................................................................................ 14 2.4 ACUTE AND CHRONIC TOXICITY ............................................................................. 14 2.4.1 METHANE PRODUCTION CURVE .................................................................... 16 2.4.2 TESTING TIME ..................................................................................................... 17 3.0 METHODOLOGY ........................................................................................................... 22
Description:The list of books you might like

The Mountain Is You

Can’t Hurt Me: Master Your Mind and Defy the Odds

Atomic Habits James Clear

$100m Offers

Enders' Homoopathische Hausapotheke, 10. Auflage
Minimal disturbance measurement for coherent states is non-Gaussian
Managing Failed Anti-Reflux Therapy

TS 125 307 - V5.5.0 - Universal Mobile Telecommunications System (UMTS); Requirements on User Equipments (Ues) supporting a release-independent frequency band (3GPP TS 25.307 version 5.5.0 Release 5)
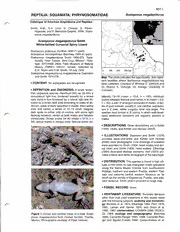
Sceloporus megalepidurus
Stefania ayangannae
Mice Other Poems by Gerald Bullett
DTIC ADA609546: Functional Characterization of a Novel Prostate-Specific Gene PrLZ in Prostate Cancer

Theban Plays
DTIC ADA561944: A Smart Microwave Vacuum Electron Device (MVED) Using Field Emitters
Molecular Biology of G-Protein-Coupled Receptors
C-TERMINI OF PROTEASOMAL ATPases PLAY NON-EQUIVALENT ROLES IN CELLULAR ...
Chronicles of Chicora Wood by Elizabeth W Allston Pringle
ERIC ED361046: Reinventing Teaching and Testing: Quality Learning for Quality Employment.
Caderno de Iniciação à Pesquisa Vol. 07
