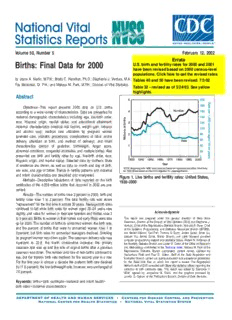
Preview Births: Final Data for 2000
Volume 50, Number 5 February 12, 2002 Births: Final Data for 2000 by JoyceA. Martin, M.P.H.; Brady E. Hamilton, Ph.D.; Stephanie J. Ventura, M.A.; Fay Menacker, Dr. P.H.; and Melissa M. Park, M.P.H., Division of Vital Statistics Abstract Objectives—This report presents 2000 data on U.S. births according to a wide variety of characteristics. Data are presented for maternal demographic characteristics including age, live-birth order, race, Hispanic origin, marital status, and educational attainment; maternal characteristics (medical risk factors, weight gain, tobacco and alcohol use); medical care utilization by pregnant women (prenatal care, obstetric procedures, complications of labor and/or delivery, attendant at birth, and method of delivery); and infant characteristics (period of gestation, birthweight, Apgar score, abnormal conditions, congenital anomalies, and multiple births).Also presented are birth and fertility rates by age, live-birth order, race, Hispanic origin, and marital status. Selected data by mother’s State of residence are shown, as well as data on month and day of birth, sex ratio, and age of father. Trends in fertility patterns and maternal and infant characteristics are described and interpreted. Figure 1. Live births and fertility rates: United States, Methods—Descriptive tabulations of data reported on the birth 1930–2000 certificates of the 4.059 million births that occurred in 2000 are pre- sented. Results—Thenumberofbirthsrose3percentin2000;birthand fertility rates rose 1 to 2percent. The total fertility rate was above ‘‘replacement’’forthefirsttimeinalmost30years.Teenagebirthrates continued to fall while birth rates for women aged 20–24 years rose Acknowledgments slightly, and rates for women in their late twenties and thirties rose 3 to5percent.Birthstowomenintheirfortiesandearlyfiftieswerealso This report was prepared under the general direction of Mary Anne upfor2000.Thenumberofbirthstounmarriedwomen,thebirthrate, Freedman,DirectoroftheDivisionofVitalStatistics(DVS)andStephanieJ. Ventura,ChiefoftheReproductiveStatisticsBranch.NicholasF.Pace,Chief and the percent of births that were to unmarried women rose 1 to of the Systems, Programming, and Statistical Resources Branch (SPSRB), 3percent, but birth rates for unmarried teenagers declined. Smoking andStevenSteimel,GailParr,ThomasD.Dunn,JordanSacks,AnnieLiu, bypregnantwomenwasdownagain.Thecesareandeliveryraterose Jiaquan Xu, Bonita Gross, Manju Sharma and Jaleh Mousavi provided computerprogrammingsupportandstatisticaltables.RobertN.Andersonof 4percent to 22.9, the fourth consecutive increase; the primary theMortalityStatisticsBranchandLesterR.CurtinoftheOfficeofResearch cesarean rate was up and the rate of vaginal births after a previous andMethodologycontributedtotheTechnicalnotes.MelissaM.Parkofthe cesareanwasdown.Thenumberandrateoftwinbirthscontinuedto Reproductive Statistics Branch coordinated content review, assisted by Yashodhara Patel and Paul D. Sutton. Staff of the Data Acquisition and rise, but the triplet/+ birth rate declined for the second year in a row. EvaluationBranchcarriedoutqualityevaluationandacceptanceprocedures For the first year in almost a decade the preterm birth rate declined for the State data files on which this report is based. The Registration (to11.6percent);thelowbirthweightrate,however,wasunchangedat MethodsstaffofDVSconsultedwithStatevitalstatisticsofficesregardingthe collection of birth certificate data. This report was edited by Demarius V. 7.6percent. Miller, typeset by Jacqueline M. Davis, and the graphics produced by Jarmila G.OgburnofthePublicationsBranch,DivisionofDataServices. Keywords: birthscbirth certificatecmaternal and infant healthc birth ratescmaternal characteristics 2 NationalVitalStatisticsReport,Vol.50,No.5,February12,2002 Highlights births that were to unmarried women increased from 33.0 in 1999 to 33.2percent in 2000. Births and birth rates for unmarried teenagers, however, declined in 2000. The number of U.S. births increased 3percent for 2000 to Cigarette smoking during pregnancy declined again in 2000, to 4,058,814, the third consecutive increase following a 7percent 12.2percent.Theoverallratehasfallensteadilysince1989,by37per- decline from 1990 to 1997. The birth rate also rose, but slightly, to cent. Tobacco use declined for teenagers and women aged 25–39 14.7birthsper1,000totalpopulationfor2000.Thefertilityrate,which years, and increased slightly for women aged 20–24 years. Overall relates births to the number of women of childbearing age, was up smoking rates remain lowest for non-Hispanic black, Chinese, Japa- 2percent for 2000, to 67.5 births per 1,000 women aged 15–44 nese, and Filipino women, and among Hispanic subgroups, Mexican years. and Cuban women. Infant birthweight is seriously compromised by Fertility rates increased for women of each racial and Hispanic maternalsmoking:In2000,11.9percentofbirthstosmokerscompared originsubgroupin2000.Ratesrose3percentorlessfornon-Hispanic with7.2percentofbirthstononsmokersweighedlessthan2,500grams white women, non-Hispanic black women, American Indian women, (5 lb 8 oz). and8to12percentforAsianorPacificIslander(API)women.Among The cesarean delivery rate increased for the fourth consecutive Hispanic subgroups, rates rose 3percent for Mexican women and 8 year, to 22.9percent of all births, a 4percent increase from 1999 to 12percent for Puerto Rican and Cuban women. For 2000, as for (22.0percent). Following declines between 1989 and 1996, the rate recentyears,thefertilityratewashighestforMexicanwomen(115per hasincreasedsteadily;the2000rateisthehighestreportedsince1989, 1,000)andlowestfornon-HispanicwhiteandCubanwomen(59and when these data first became available from birth certificates. The 57 per 1,000). increaseinthetotalcesareanratefor1999–2000wastheresultofa TheU.S.totalfertilityrate(TFR)movedabove‘‘replacement’’(the 4percentriseintherateofprimarycesareandeliveriesanda12per- rateatwhichagivengenerationcanexactlyreplaceitself)forthefirst centdropintherateofvaginalbirthsafterpreviouscesareans(VBAC). timeinalmost30yearsin2000.TheTFR,whichestimatesthenumber Thepretermbirthrate,orpercentofinfantsbornatlessthan37 ofbirthsthatacohortof1,000womenwouldhaveiftheyexperienced completedweeksofgestation,wasdownforthefirstyearinalmosta throughout their childbearing years the same age-specific birth rates decade,from11.8to11.6percentfor1999–2000.Thepretermbirthrate observed in a given year, increased 3percent for the current year to rose fairly steadily, by 25percent between 1981 and 1999. The very 2,130.0. preterm birth rate (gestation of less than 32 completed weeks) was Thebirthrateforteenagersdeclinedagainin2000,falling2per- 1.93percentfor2000,comparedwith1.96percentfor1999.Preterm centto48.5birthsper1,000womenaged15–19years,arecordlow ratesdeclinedslightlyforeachofthethreelargestracial/ethnicgroups fortheNation.Theratehasdeclined22percentsince1991(62.1).The for the current year. Since the early 1990s, the rate of preterm birth birthrateforyoungteenagers15–17yearsfell5percentfrom1999to fornon-Hispanicblackinfants,althoughstillmuchhigherthanthatfor 2000to27.4per1,000,alsoanall-timelow,and29percentbelowthe othergroups,hasimprovedsomewhat(from18.9to17.4percent),but 1991peak.Therateforolderteenagers18–19yearsdeclined1percent the preterm rate has been essentially unchanged for Hispanic births to 79.2. The rate for older teenagers has declined 16percent since (at about 11.2percent), and has deteriorated for non-Hispanic white 1991. Reductions in teenage birth rates have been particularly large births (from 8.5 to 10.4percent). for young black teenagers (down 40percent since 1991 to a record Thepercentlowbirthweight(LBW)(lessthan2,500grams)was low),butallpopulationgroupshaveexperienceddeclines.Theteenage unchanged for 2000 at 7.6percent. The LBW rate has risen from pregnancyratehasdeclined19percentinthe1990s,to94.3per1,000 6.8percentinthemid-1980s,arisethathasbeenlinkedinparttothe teenagers15–19yearsin1997,reflectingconcurrentdeclinesinbirth increasedmultiplebirthrate.Therateofverylowbirthweight(VLBW) and abortion rates. (less than 1,500 grams) was 1.43percent for 2000, essentially Thebirthrateforwomenintheirearlytwentiesincreasedslightly unchangedfrom1999(1.45percent),butupfrom1.16percentin1981. in 2000 to 112.3 per 1,000 women aged 20–24 years. The rate for LBWlevelswereunchangedfornon-Hispanicwhitebirths(6.6percent) womenaged25–29yearsrose3percentto121.4per1,000,itshighest and Hispanic births (6.4percent), but declined slightly among black level since 1971. Birth rates for women in their twenties have been births (13.2 to 13.1percent). relativelystableoverthepast20years.Birthratesforwomenintheir The number and rate of twin births continued to climb for 2000, thirties increased 5percent, to 94.1 per 1,000 women aged 30–34 risingto118,916or29.3per1,000totalbirths.Thetwinningratehas years,andto40.4per1,000womenaged35–39years.Thebirthrate risen55percent,from18.9per1,000since1980.Thedramaticupsurge forwomen40–44yearsincreasedagainin2000to7.9per1,000.Rates in triplet and other higher order multiple births (triplet/+) over the last for women aged 45–49 years also rose in 2000. two decades, however, may be at an end—the triplet/+ birth rate Thefirstbirthrateroseaswellin2000,to27.1firstbirthsper1,000 declined for the second consecutive year to 180.5 triplet/+ births per womenaged15–44years,thesecondconsecutiveincreaseinthisrate. 100,000livebirths.Therateoftriplet/+birthshadsurgedfrom37.0to Themedianageatfirstbirthincreasedto24.6years;themedianage 193.5 between 1980 and 1998. There were 7,325 births in triplet/+ of first-time mothers has risen fairly consistently over the last three deliveriesin2000,aboutthesameasthatfor1999.Thetriplet/+birth decades. rate was down among non-Hispanic white and non-Hispanic black All measures of childbearing by unmarried women increased in women,butwasupslightlyforHispanicwomen.Twinbirthratesrose 2000.Thebirthraterose2percentto45.2birthsper1,000unmarried for all three groups. womenaged15–44years.Thenumberofbirthsincreased3percent to1,347,043,thehighestnumbereverreported,andthepercentofall NationalVitalStatisticsReport,Vol.50,No.5,February12,2002 3 Introduction American Indian and Asian or Pacific Islander (API) births are not shownseparatelybyHispanicoriginbecausethevastmajorityofthese This report presents detailed data on numbers and characteris- populationsarenon-Hispanic.Dataarealsopresentedforthefollowing tics of births in 2000, birth and fertility rates, maternal lifestyle and fiveHispanicsubgroups:Mexican,PuertoRican,Cuban,Centraland health characteristics, medical services utilization by pregnant South American, and other and unknown Hispanic. However, when women, and infant health characteristics. These data provide impor- reportingbirthratesforHispanicsubgroups,birthstoCentralandSouth tantinformationonfertilitypatternsamongAmericanwomenbysuch AmericanwomenareaddedtobirthstootherandunknownHispanic characteristics as age, live-birth order, race, Hispanic origin, marital women because population data for Central and South American status, and educational attainment. Up-to-date information on these women are not available. Data are shown for five API subgroups: fertility patterns is critical to understanding population growth and Chinese,Japanese,Hawaiian,Filipino,and‘‘other’’API.Inaddition,11 change in this country and in individual States. Data on maternal States report data on API subgroups included in the ‘‘other API’’ characteristics such as weight gain, tobacco and alcohol use, and category (Vietnamese, Asian Indian, Korean, Samoan, Guamanian, medical risk factors are useful in accounting for differences in birth and remainingAPI); see Technical notes. outcomes. Information on use of prenatal care, obstetric procedures, U.S. and State-level birth and fertility rates in this report are complicationsoflaborand/ordelivery,attendantatbirthandplaceof computedonthebasisofpopulationdenominatorsprovidedbytheU.S. delivery, and method of delivery by maternal demographic character- CensusBureau.Allpopulationestimatesareprojectedfromthe1990 isticscanalsohelptoexplaindifferencesinbirthoutcomes.Itisvery censusbecausedetailedpopulationsfromthe2000censuswerenot important that data on birth outcomes, especially levels of low available when this report was prepared. A comparison of summary birthweight and preterm birth, be continuously monitored, because 2000censuspopulationresultswiththeunpublishedestimatesfor2000 these variables are important predictors of infant mortality and projected from the 1990 census indicates that the U.S. Hispanic morbidity. population used for this report is 8percent lower than the population Areportofpreliminarybirthstatisticsfor2000presenteddataon based on the 2000 census (5, 6, 7). The underestimate for Hispanic selected topics based on a substantial sample (96.3percent) of the women aged 15–44 years is 9.5percent (compared with an under- 2000 birth file (1). Findings for the selected measures (age, race, estimateof2percentforallwomenaged15–44years).Therefore,the Hispanicorigin,maritalstatusofmother,live-birthorder,prenatalcare, Hispanicbirthandfertilityratespresentedhereareoverstatedbecause cesareandelivery,andlowbirthweight)basedonthepreliminarydata the population base is too small. Similar but less pronounced effects are very similar to those presented here based on final data. forotherpopulationgroupsarealsolikely;seeTechnicalnotes.When Inadditiontothetabulationsincludedinthisreport,moredetailed the necessary population estimates based on the 2000 census and analysis is possible by using the Natality public-use data tape that is intercensalestimatesbecomeavailable,population-basedratesforthe issuedforeachyear.BirthdataarealsoavailableinCD-ROMformat 1990s and 2000 will be recalculated and presented in an upcoming since1990,andaselectionoftablesofdetaileddataareavailableon report.RatesbyStateshowninthisreportalsomaydifferfromrates the NCHS home page at http://www.cdc.gov/nchs/datawh/statab/ computed on the basis of other population estimates. unpubd/natality/natab98.htm (2, 3). Informationonthemeasurementofmaritalstatus,gestationalage, andbirthweight;thecomputationofderivedstatisticsandrates;popu- lationdenominators;randomvariationandrelativestandarderror;and Methods the definitions of terms are presented in the Technical notes. Data shown in this report are based on 100percent of the birth Informationonbirthsbyage,race,ormaritalstatusofmotheris certificatesregisteredinallStatesandtheDistrictofColumbia.More imputedifitisnotreportedonthebirthcertificate.Theseitemswere than 99percent of births occurring in this country are registered (4). not reported for less than 1percent of U.S. births in 2000. (See Tables that show data by State also provide separate information for Technicalnotesforadditionalinformation.)Allothermaternalandinfant Puerto Rico, Virgin Islands, Guam, American Samoa, and the characteristics(exceptitemsonwhichlengthofgestationiscalculated) Commonwealth of the Northern Marianas. However, these areas are are not imputed; see Technical notes. Births for which a particular not included in totals for the United States. characteristicisunknownaresubtractedfromthefiguresfortotalbirths In this report, tabulations of births beginning with 1980 data are thatareusedasdenominatorsbeforepercents,percentdistributions, by race of mother; for years prior to 1980, tabulations are by race of and medians are computed. Thus, for example, the proportion of child.Detailsofthedifferencesintabulationprocedurearedescribed womenreceivingcareinthefirsttrimesterofpregnancyiscomputed intheTechnicalnotes.Textreferencestoblackbirthsandblackmothers on the basis of births for which month prenatal care began was or white births and white mothers are used interchangeably for ease reported.Levelsofnonreportingvarysubstantiallybyspecificitemand in writing. by State. TableI in the Technical notes provides information on the RaceandHispanicoriginarereportedindependentlyonthebirth percentofrecordswithmissinginformationforeachitembyStatefor certificate.IntabulationsofbirthdatabyraceandHispanicorigin,data 2000.Readersshouldnotethatthelevelsofincompleteorinaccurate forHispanicpersonsarenotfurtherclassifiedbyracebecausethevast reportingforsomeoftheitemsarequitehighinsomeStates.Datafor majorityofwomenofHispanicoriginarereportedaswhite.Mosttables 2000forConnecticut,theDistrictofColumbia,Hawaii,Kentucky,Ohio, in this report show data for these categories: white total, white non- Oklahoma, and Washington as well as the Northern Marianas are of Hispanic, black total, black non-Hispanic, and Hispanic. Data for particular concern. 4 NationalVitalStatisticsReport,Vol.50,No.5,February12,2002 Demographic characteristics increased 2percent for API women since 1990. Trends in Hispanic fertility by subgroup for 1989–95 are presented in more detail in a separate report (8). Births and birth rates Age of mother Number of births Teenagers—Birthratesforteenagersdroppedcontinuouslyfrom The number of births in the United States rose to 4,058,814 in 1991to2000,reachingnewrecordlowsin2000insomecases.The 2000 from 3,959,417 in 1999, an increase of 3percent. This marks birth rate for the youngest teenagers was unchanged in 2000, at the third consecutive increase. Between 1990, the most recent high 0.9birthsper1,000females10–14years(table4).Thisratedeclined point in U.S. births, and 1997, the most recent low, the number of steadilyfrom1994through1999(theratewas1.4ineachyear1989 births declined 7percent. Since 1997, however, the number of births through 1994). The number of births to 10–14-year-olds dropped has risen 5percent. (See tables1–12 for national and State birth 6percent from 1999 to 2000, to 8,519, the lowest total reported in data by age, live-birth order, race, and Hispanic origin). any year since 1966 (8,128 births). Increasesinthenumberofbirthswereobservedforallraceand Thebirthrateforteenagers15–19yearsdeclined2percentto ethnic groups in 2000 (tables1 and 6), but the magnitude of the 48.5per1,000in2000,anotherrecordlowfortheNation.Thisratehas increases differed. Births to non-Hispanic white, non-Hispanic black, declined 22percent from 1991 when the rate reached a peak (62.1) and American Indian women rose 1 to 4percent compared with an (tableA).Thedeclinesinthe1990sthrough2000intheteenagebirth 11percentriseforAsianorPacificIslander(API)births.AmongtheAPI ratereversethe24-percentincreasethatoccurredfrom1986(50.2per subgroups, increases ranged from 3percent for Japanese, to 19 1,000) to 1991. The reductions in teenage birth rates since the mid- percentforChinesebirths.BirthstoHispanicmothersrose7percent, 1990s primarily reflect declines in the first birth rate, meaning that butsubstantialincreaseswerelimitedtotwosubgroups:Mexicanand fewerteenagersarebecomingmothersforthefirsttime.Thefirstbirth Central and SouthAmerican. Crude birth rate Table A. Birth rates for teenagers 15–19 years by age, race, and Hispanic origin of mother: United States, 1991, The crude birth rate rose from 14.5 live births per 1,000 total 1999, and 2000, and percent change, 1991–2000 and population in 1999 to 14.7 in 2000, a 1percent increase from the 1999–2000 record lows reported for 1997 and 1999, but still lower than any rate [Ratesarelivebirthsper1,000womeninspecifiedgroup] from 1977 through 1995. The crude birth rate rose 14percent between 1975 (14.6) and 1990 (16.7), but fell 13percent between Non-Hispanic Asianor 1990 and 1997. American Pacific Yearandage Total1 White Black Indian2 Islander2 Hispanic3 15–19years Fertility rate 2000 . . . . . . . . . . 48.5 32.5 81.9 67.8 21.6 94.4 1999 . . . . . . . . . . 49.6 34.0 83.7 67.8 22.3 93.4 The general fertility rate, which relates births to the number of 19914. . . . . . . . . . 62.1 43.4 118.9 85.0 27.4 106.7 women in their childbearing ages, was 67.5 live births per 1,000 Percentchange, women aged 15–44 years in 2000, 2percent higher than that for 1991–2000. . . . . . –22 –25 –31 –20 –21 –12 1999 (65.9). Like the number of births and the birth rate, the recent Percentchange, 1999–2000. . . . . . –2 –4 –2 0 –3 1 high point for the fertility rate was 1990 (70.9). After dropping 8percent between 1990 and 1997, the fertility rate has increased 15–17years 4percent since 1997 (table1 and figure1), signaling an apparent 2000 . . . . . . . . . . 27.4 15.8 52.0 39.6 11.5 60.0 halt to the downward trend observed in the 1990s. 1999 . . . . . . . . . . 28.7 17.1 53.7 41.4 12.3 61.3 19914. . . . . . . . . . 38.7 23.6 86.7 52.7 16.1 70.6 Increases in fertility rates were reported for each race and Hispanicorigingroupfor2000.Ratesincreased2percentorlessfor Percentchange, 1991–2000. . . . . . –29 –33 –40 –25 –29 –15 non-Hispanicwhite(58.5per1,000aged15–44years),non-Hispanic Percentchange, black(73.7),andAmericanIndianwomen(71.4),and8percentforAPI 1999–2000. . . . . . –5 –8 –3 –4 –7 –2 women(70.7).AmongHispanicsubgroups,ratesincreased2percent 18–19years for‘‘other’’Hispanic,3percentforMexican,8to12percentforPuerto 2000 . . . . . . . . . . 79.2 56.8 125.1 113.1 37.0 143.6 Rican (84.3), and Cuban women (57.3) (tables1 and 6). (Birth and 1999 . . . . . . . . . . 80.3 58.9 126.8 110.6 38.0 139.4 fertilityratesfortheAPIsubgroupscannotbecomputedbecausethe 19914. . . . . . . . . . 94.4 70.5 163.1 134.3 43.1 158.5 necessary populations are not available.) Percentchange, Acomparison of recent trends in fertility rates reveals important 1991–2000. . . . . . –16 –19 –23 –16 –14 –9 Percentchange, differencesamongtheraceandHispanicoriginsubgroups.Since1990, 1999–2000. . . . . . –1 –4 –1 2 –3 3 fertilityhasdeclinedforMexican(3percent),non-Hispanicwhite(7per- cent), and non-Hispanic black women (17percent), but increased for 1Includesoriginnotstated. 2IncludespersonsofHispanicandnon-Hispanicorigin. Puerto Rican (2percent), and Cuban women (9percent).The fertility 3PersonsofHispanicoriginmaybeofanyrace. rate has decreased 6percent for American Indian women and 4Seereference8forinformationonreportingareasin1991. NationalVitalStatisticsReport,Vol.50,No.5,February12,2002 5 Figure 2. Birth rates by age of mother: United States, 1960–2000 ratedeclined18percentfrom1994to2000.State-specificbirthrates Teenage birth rates by race and Hispanic origin vary sub- for teenagers are discussed in the section ‘‘Births and birth rates by stantially(tables3,4,8,and9).Thediscontinuitiesinpopulationdata State.’’ based on the 1990 and 2000 censuses described in the ‘‘Methods’’ Birthratesforteenagesubgroups15–17and18–19yearsalso sectiondiminishbutdonoterasethesevariations.Ratesin2000,as fellbetween1999and2000.Therateforteenagers15–17yearsdeclined inpreviousyears,werehighestforMexican,non-Hispanicblack,Puerto 5percent to 27.4 per 1,000, an all-time low (3, 9). This rate dropped Rican, and American Indian teenagers and lowest for non-Hispanic 29percent from 1991 (38.7) to 2000 (tablesA, 4, and figure2). The white, Cuban, andAPI teenagers, a pattern that has been observed number of births to teenagers 15–17 years fell 4percent during since1994.Despitethemarkedvariationinrates(rangingin2000from 1999–2000to157,209,fewerthaninanyyearsince1955(149,722). 21.6 to 101.7 per 1,000 aged 15–19 years), all population groups Thebirthrateforolderteenagers18–19yearsdeclined1percent, experiencednotabledeclinesfrom1991to2000:TheratesforMexican, to79.2per1,000in2000.Since1992,whentheratereacheditsrecent Puerto Rican, Cuban, and ‘‘other’’ Hispanic teenagers fell by 6 to high(94.5),ithasdeclined16percentandisatitslowestpointinmore 13percenteach,whileratesforAmericanIndianandAPIteenagersfell than a decade (78.5 in 1987).There was a very slight decline in the 20to21percentandratesfornon-Hispanicwhiteandblackteenagers number of births to older teenagers between 1999 and 2000—to dropped24and31percent,respectively.Therateforblackteenagers 311,781. for 2000 is an historic low (data available since 1960). 6 NationalVitalStatisticsReport,Vol.50,No.5,February12,2002 Teenage pregnancy rates (based on the sum of live births, recentlow(3.8),to2000,theratemorethandoubled;thecurrentyear inducedabortions,andfetallosses)havealsodeclinedinrecentyears rateisthehighestsince1970(8.1).During1990–2000,thenumberof (10,11).Thepregnancyrateforteenagers15–19yearsfell19percent births to this age group rose from 48,607 to 90,013. from116.5per1,000in1991to94.3in1997,reversingan11percent The birth rate for women aged 45–49 years increased to 0.5 rise from 1986 to 1991 (10, 11). (The most recent year for which births per 1,000 in 2000, the highest level reported in 30 years. pregnancy rates are available is 1997.) Pregnancy rates for teenage Reflectingnotonlythecontinuedincreaseinthenumberofwomenin subgroupshavefallenaswell,atapacesimilartothedeclinesinthe this age group (who were born between 1951 and 1955), but also a birth rates: The rate for young teenagers dropped 20percent during greater likelihood to give birth, the number of births to women aged 1991–97,to63.7per1,000,whiletherateforolderteenagersdeclined 45–49 years was up 4percent to 4,349 in 2000, the highest number 15percentto141.7per1,000.Furtherdeclinesinteenagepregnancy recorded in more than three decades. rates since 1997 are likely based on the sustained decline in the Births to women aged 50 years and over—Data on births to teenage birth rate. womenaged50–54yearshaveonlyrecentlybecomeavailableagain. Thefactorsaccountingforthecurrentdownturninteenagepreg- From1964to1996,ageofmotherwasimputedforagesunder10years nancy and birth rates are discussed in recent reports (9–11). Briefly, and 50 years or over (4). (See Technical notes.) In 2000 there were the proportion of teenagers who are sexually experienced has stabi- 255birthstowomenaged50–54years,asubstantialincreaseoverthe lizedandinsomecasesdeclinedinthemid-1990s,reversingthesteady 174birthsreportedfor1999(tables2and7for2000data).Despite increasesoverthepasttwodecades(12–14).Manypublicandprivate theincrease,thenumberofbirthstowomenaged50–54yearsremains initiatives have focused teenagers’ attention on the importance of toosmalltocomputeanage-specificbirthrate.Incomputingbirthrates pregnancy prevention through abstinence and responsible behavior by age of mother, births to women aged 50–54 years have been (15).Moreover,teenagersaremorelikelytousecontraceptivesatfirst includedwithbirthstowomenaged45–49years;thedenominatorfor intercourse,especiallycondoms(14,16).Somesexuallyactiveteen- the rate is women aged 45–49 years. agershaveswitchedtoimplantandinjectablecontraceptives,whichare Theriseinthebirthratesforwomenintheirlatethirtiesandolder effective new birth control methods (10,14,16). for the last 20 years (table4) has been linked to several factors, Women aged 20 years and over: Women in their includingtheavailabilityanduseoffertility-enhancingtherapies.Among twenties—The birth rate for women aged 20–24 years increased currentlychildlesswomenaged35–44yearsreportingimpairedfecun- slightly in 2000 to 112.3, from 111.0 in 1999. The rate for this group dity,accordingtotheNationalSurveyofFamilyGrowth,theproportion fell6percentfrom1990(116.5)to1995(109.8),buthasrisen2percent seekingfertilitytreatmentroseconsiderablyfrom1982to1995(12,20). since (tables3, 4, 8, and 9).The rate for women aged 25–29 years For2000,103ofthe255birthstowomenaged50–54yearswereborn rose3percentin2000to121.4,itshighestlevelsince1971;thisrate inamultipledelivery,anoutcomeassociatedwithinfertilitytherapy(see hasincreased8percentsince1995(112.2),followingsteadydeclines section on ‘‘Multiple births’’). during 1990–95. Birth rates for women in their twenties, the principal childbearingages,havebeenrelativelystableoverthepast20years. Live-birth order Women in their thirties—Birth rates for women in their thirties increased 5percent in 2000. Rates for women in these age groups The first birth rate for women aged 15–44 years was 27.1 in haveincreasedquitesteadilysincethemid-tolate1970s(tables4and 2000, a 2percent increase over the 1999 rate (26.6) (table5). 9)(3,17).Therateforwomenaged30–34yearsincreasedto94.1 Despite the recent increase, the rate for 2000 was 7percent lower per1,000in2000from89.6in1999.The2000ratewashigherthan than in 1990 (29.0). Rates for second- and fourth- order births also foranyyearsince1965(94.4),and80percenthigherthanthelowpoint increased 2percent each from 1999. Rates for third- and fifth-order reportedfor1975(52.3)(3,17).Therateofincreasehasslowedduring births rose 4 and 7percent, respectively, whereas higher-order birth the 1990s to about 1percent per year compared with the 3percent rates were stable. annual increases for 1975–90.The number of births to women aged The first birth rate increased 2percent overall, but substantial 30–34yearsincreased4percentforthecurrentyeareventhoughthe differencesintrendsbyageofmotherwereobserved(seetable3for number of women in that age group declined slightly (7). 2000data).Ratesforteenagers15–17and18–19yearsdeclinedby The birth rate for women aged 35–39 years also increased 4and1percent,respectively,comparedwith1and2percentincreases 5percent to 40.4.This represents a more than 100percent increase for women aged 20–24 and 25–29 years, and a rise of 6percent for from1978(19.0);the2000ratematchestheprevioushighin1966(3). womenaged30–44years.Womenaged30yearsandoveraccounted Between 1990 and 2000 the rate rose 27percent, but the pace of for24percentofallfirstbirthsin2000,essentiallyunchangedfromthe increase for this age group has slowed slightly over the last decade, proportionin1999,butsubstantiallyhigherthanthe5percentreported tojustover2percentannually,comparedwith4percentperyearfrom for 1975 (17). 1978 to 1990. The number of births to women aged 35–39 years A more general measure useful in interpreting age trends in reachedanotherrecordhighin2000(452,057).Thisnumberhasrisen childbearingisthemedianageatfirstbirth.Themedianageisthe by 42percent since 1990 (317,583), compared with a 13percent middlepoint,orcenter,ofthedistributionofageatfirstbirth.Ranked increase in the population of this age group (18, 19).Among women inorderofageofmother,50percentofthebirthswouldoccurabove intheirthirties,birthrateswerehighestforAPI,Mexican,and‘‘other’’ andbelowthemedianage.Themedianageatfirstbirthin2000was Hispanic women (tables3 and 8). 24.6 years compared with 24.5 years in 1999. While the increase in Womenintheirforties—Thebirthrateforwomenaged40–44 2000 was small, the tendency of women to postpone childbearing, yearsincreasedto7.9per1,000in2000from7.4for1999.Thisrate observed since the early 1970s, continues largely unabated (3). The hasincreased44percentsince1990,from5.5.From1981,themost medianageatfirstbirthhasrisenfrom22.0yearsin1972.Themean NationalVitalStatisticsReport,Vol.50,No.5,February12,2002 7 age at first birth is another general measure useful in reviewing age Births and birth rates by State patternsinfertility.(Themeanisequaltothesumofallobservations BirthdatabyraceandbyHispanicoriginfor2000areshownin dividedbythetotalnumberofobservations.)Themeanageoffirst-time tables10–12forthe50States,theDistrictofColumbia,PuertoRico, mothers in 2000 was 24.9 years, compared with 24.8 years in 1999. the Virgin Islands, Guam, American Samoa, and the Northern Marianas. It is important to note that the American Indian, Asian or Total fertility rate Pacific Islander (API), and Hispanic populations (and Hispanic The total fertility rate (TFR) summarizes the potential impact of subgroups) are highly concentrated geographically. currentfertilitypatternsoncompletedfamilysize.TheTFRestimates The majority of States (46 of 50) and the District of Columbia the number of births that a hypothetical (or ‘‘synthetic’’) cohort of reported increases in the number of births for 2000. Increases of 1,000 women would have if they experienced throughout their about2percentwerereportedformostStates,butbirthsroseatleast childbearing years the same age-specific birth rates observed in a 4percent or more in North Carolina, Colorado, Arizona, Nevada, given year. The rate can be expressed as the average number of Georgia,Texas, and New Hampshire. Births declined in Maine, Con- childrenthatwouldbebornperwoman.Becauseitiscomputedfrom necticut,Vermont,andSouthDakota.Thenumberofbirthswasalso age-specific birth rates, the TFR is age-adjusted and can be readily downforalloftheterritoriesexcepttheNorthernMarianaswherearise comparedforpopulationsacrosstimeoramonggeographicareas.In of 4percent was reported. 2000 the TFR was 2,130.0 (or 2.13 births per woman), 3percent Crude birth rates by State for the current year ranged from 11 higherthantheratein1999(2,075.0)(tables4and9).TheTFRhas birthsper1,000totalpopulation(MaineandVermont)to22per1,000 risen 5percent since 1995, reversing the decline from 1990 to 1995. (Utah) (table10). Birth rates increased significantly in 22 States and The increase in the TFR in 2000 is the result of increases in theDistrictofColumbia,anddeclinedsignificantlyintheVirginIslands age-specific birth rates for women aged 20 years and over; the birth andGuam.Anincreaseof4percentwasrecordedforNorthCarolina, rate of women aged 15–19 years declined (see section above on whereasadecreaseof7percentormorewasmeasuredfortheVirgin ‘‘Age of mother’’). Islands and Guam. TheU.S.TFRfor2000wasabovethe‘‘replacement’’rate(2,100) Fertility rates per 1,000 women aged 15–44 years in 2000 forthefirsttimeinnearly30years.The‘‘replacement’’rateistherate ranged from a low of 49 (Vermont and Maine) to a high of 94 (Utah) at which a given generation can exactly replace itself. While TFRs (table10). Rates increased significantly in 40 States, the District of increasedforallraceandHispanicorigingroupsin2000,substantial Columbia,andtheNorthernMarianas,anddeclinedsignificantlyinthe differences among groups continue. The TFR was above ‘‘replace- VirginIslands,Guam,andAmericanSamoa.Ratesrose4percentor ment’’forMexican,PuertoRican,‘‘other’’Hispanic,non-Hispanicblack, moreforNorthCarolina,Hawaii,Colorado,Arizona,andtheDistrictof and American Indian women, but below ‘‘replacement’’ for Asian or Columbia, but declined by 10percent or more for the Virgin Islands, Pacific Islander (API), non-Hispanic white, and Cuban women Guam, andAmerican Samoa. (tables4, 9, 13, and 14). TFRs for most race and ethnic groups State-specific total fertility rates (TFRs) for 2000 are shown in increased3percentorlessbetween1999and2000,buttheTFRfor table10.These rates provide a summary measure of lifetime fertility API women was up 8percent. State-specific TFRs for 2000 are dis- at the State level; rates for 1980, 1990, and 1996–99 have been cussed in the next section. published (22–27). The TFRs by State for 2000 varied substantially TheU.S.TFRcontinuestobehighincomparisontothoseofmost fromahighof2,761.5(or2.76birthsperwoman)forUtahtoalowof developed countries.According to the latest available data,TFRs for 1,565.5(1.57birthsperwoman)forVermont.DifferencesintheTFRs selecteddevelopedcountriesrangedfrom1.2forSpainto2.1forthe andchangesbetween1999and2000byStatearequitesimilartothose U.S.(21).(SeetableB).Itshouldbenoted,however,thatTFRscan for the general fertility rate. vary substantially, even among developed countries, and any com- Birth rates for teenagers parisonbetweentheUnitedStatesandothercountriesshouldtakeinto Birth rates for teenagers vary considerably by State (tablesC account the relative diversity of the U.S. population. and10).Birthratesforteenagers15–19yearsrangedfrom23.4per 1,000inNewHampshireto72.0inMississippifor2000.Althoughnot directly comparable, because it is a city, the highest rate was for the District of Columbia, 80.7. Teenage birth rates in 2000 were lower Table B. Total fertility rate for selected developed than in 1999 in all but 11 States. The decade-long trend of falling countries: 1994, 1995, or 2000 teenage birth rates in the Nation has been replicated in all States (tableB). Birth rates in 2000 were significantly lower than in 1991 in Country Totalfertilityrate every State and in the District of Columbia, the Virgin Islands, and Spain. . . . . . . . . . . . . . . . . . . . . 1.2 Guam, with overall declines ranging from 12 to 35percent. Informa- Germany. . . . . . . . . . . . . . . . . . . 1.3 tion on current trends and variations in teenage birth rates by State, Japan. . . . . . . . . . . . . . . . . . . . . 1.5 UnitedKingdom. . . . . . . . . . . . . . . 1.7 age, race, and Hispanic origin, is presented in a recent report (9). Australia. . . . . . . . . . . . . . . . . . . 1.8 Ireland . . . . . . . . . . . . . . . . . . . . 1.9 Sex ratio Norway. . . . . . . . . . . . . . . . . . . . 1.9 The relative number of births by sex is important because it Iceland. . . . . . . . . . . . . . . . . . . . 2.1 UnitedStates. . . . . . . . . . . . . . . . 2.1 affectspopulationdynamics,andthussocialandeconomicdynamics. In 2000 there were 2,076,969 male live births compared with SOURCE:U.N.WorldFertilityPatterns1997. 1,981,845 female live births, a ratio of 1,048 males per 1,000 8 NationalVitalStatisticsReport,Vol.50,No.5,February12,2002 Table C. Birth rates for teenagers 15–19 years by State, 1991 and 2000, and percent change, 1991–2000: United States and each State and territory [Ratesarelivebirthsper1,000estimatedfemalepopulationaged15–19yearsineacharea] Percent Percent change, change, State 1991 2000 1991–2000 State 1991 2000 1991–2000 UnitedStates1. . . . . . . . . . . . . . . . 62.1 48.5 –22 Nebraska. . . . . . . . . . . . . . . . . . . 42.4 37.2 –12 Nevada. . . . . . . . . . . . . . . . . . . . 75.3 62.2 –17 Alabama. . . . . . . . . . . . . . . . . . . 73.9 62.9 –15 NewHampshire. . . . . . . . . . . . . . . 33.3 23.4 –30 Alaska . . . . . . . . . . . . . . . . . . . . 65.4 42.4 –35 NewJersey . . . . . . . . . . . . . . . . . 41.6 31.7 –24 Arizona. . . . . . . . . . . . . . . . . . . . 80.7 69.1 –14 NewMexico. . . . . . . . . . . . . . . . . 79.8 66.2 –17 Arkansas. . . . . . . . . . . . . . . . . . . 79.8 68.5 –14 NewYork . . . . . . . . . . . . . . . . . . 46.0 35.6 –23 California. . . . . . . . . . . . . . . . . . . 74.7 48.5 –35 NorthCarolina. . . . . . . . . . . . . . . . 70.5 59.9 –15 Colorado. . . . . . . . . . . . . . . . . . . 58.2 49.2 –15 NorthDakota . . . . . . . . . . . . . . . . 35.6 28.2 –21 Connecticut . . . . . . . . . . . . . . . . . 40.4 31.9 –21 Ohio . . . . . . . . . . . . . . . . . . . . . 60.5 45.6 –25 Delaware. . . . . . . . . . . . . . . . . . . 61.1 51.6 –16 Oklahoma . . . . . . . . . . . . . . . . . . 72.1 60.1 –17 DistrictofColumbia . . . . . . . . . . . . 114.4 80.7 –29 Oregon. . . . . . . . . . . . . . . . . . . . 54.9 43.2 –21 Florida . . . . . . . . . . . . . . . . . . . . 68.8 52.6 –24 Pennsylvania . . . . . . . . . . . . . . . . 46.9 35.2 –25 Georgia . . . . . . . . . . . . . . . . . . . 76.3 64.2 –16 RhodeIsland . . . . . . . . . . . . . . . . 45.4 38.4 –15 Hawaii . . . . . . . . . . . . . . . . . . . . 58.7 45.1 –23 SouthCarolina . . . . . . . . . . . . . . . 72.9 60.6 –17 Idaho. . . . . . . . . . . . . . . . . . . . . 53.9 43.1 –20 SouthDakota. . . . . . . . . . . . . . . . 47.5 37.2 –22 Illinois . . . . . . . . . . . . . . . . . . . . 64.8 49.5 –24 Tennessee. . . . . . . . . . . . . . . . . . 75.2 61.5 –18 Indiana. . . . . . . . . . . . . . . . . . . . 60.5 50.3 –17 Texas. . . . . . . . . . . . . . . . . . . . . 78.9 69.2 –12 Iowa . . . . . . . . . . . . . . . . . . . . . 42.6 34.7 –19 Utah . . . . . . . . . . . . . . . . . . . . . 48.2 40.0 –17 Kansas. . . . . . . . . . . . . . . . . . . . 55.4 45.3 –18 Vermont . . . . . . . . . . . . . . . . . . . 39.2 24.1 –39 Kentucky. . . . . . . . . . . . . . . . . . . 68.9 55.3 –20 Virginia. . . . . . . . . . . . . . . . . . . . 53.5 40.8 –24 Louisiana. . . . . . . . . . . . . . . . . . . 76.1 62.1 –18 Washington . . . . . . . . . . . . . . . . . 53.7 38.2 –29 Maine. . . . . . . . . . . . . . . . . . . . . 43.5 28.7 –34 WestVirginia . . . . . . . . . . . . . . . . 57.8 46.4 –20 Maryland. . . . . . . . . . . . . . . . . . . 54.3 41.6 –23 Wisconsin . . . . . . . . . . . . . . . . . . 43.7 34.5 –21 Massachusetts . . . . . . . . . . . . . . . 37.8 27.1 –28 Wyoming. . . . . . . . . . . . . . . . . . . 54.2 40.8 –25 Michigan. . . . . . . . . . . . . . . . . . . 59.0 39.2 –34 Minnesota. . . . . . . . . . . . . . . . . . 37.3 29.6 –21 PuertoRico . . . . . . . . . . . . . . . . . 72.4 71.5 –1** Mississippi. . . . . . . . . . . . . . . . . . 85.6 72.0 –16 VirginIslands . . . . . . . . . . . . . . . . 77.9 46.8 –40 Missouri . . . . . . . . . . . . . . . . . . . 64.5 48.8 –24 Guam. . . . . . . . . . . . . . . . . . . . . 95.7 69.5 –27 Montana. . . . . . . . . . . . . . . . . . . 46.7 35.8 –23 AmericanSamoa. . . . . . . . . . . . . . --- 38.1 --- NorthernMarianas . . . . . . . . . . . . . --- 61.1 --- **Notsignificantatp<.05. ---Datanotavailable. 1Excludesdatafortheterritories. females. This compares with a ratio of 1,049 for the previous year Theobservedmonthlybirthrateswerehigherfor9monthsof2000 (tables13 and 14).The annual sex ratio has changed little over the than the rates for the same months in 1999; the observed monthly last60years,varyingbylessthan1percent(1,055in1940).Athough fertility rates were higher for 10 months compared with the same thedifferenceissmall,ifthe1940ratioprevailedin2000,therewould monthsin1999.Whenseasonalvariationisfilteredfromthemonthly have been 6,753 more male births. birth and fertility rates, an estimate of the underlying trends in these Sexratiosdifferwidelybyraceandethnicity.In2000theratiofor ratesisobtained.Theseasonallyadjustedbirthratesfor9monthsand Japanese mothers was 1,084, the highest number of male to female theseasonallyadjustedfertilityratesfor11monthswerehigherin2000 births, while the sex ratio for non-Hispanic black mothers was a than for the same months in 1999. November had the highest comparativelylow1,031.(RatiosforblackandAmericanIndianbirths seasonally adjusted birth rate and the highest seasonally adjusted are typically lower than those of other groups.)As in previous years, fertilityratein2000.Aprilhadthelowestseasonallyadjustedbirthrate the sex ratio for Hispanic (1,043), was intermediate between non- and the lowest seasonally adjusted fertility rate. In general, the dif- Hispanic white (1,053) and non-Hispanic black births. Differences ferences among monthly birth rates have declined since 1950. amonggroupsmaybeduetoenvironmentaland/ormaternalconditions (28–30). Day of the week of birth Month of birth The average number of births on any given day was 11,090 in August was the month with the most births in 2000, while the 2000 (table16). However, substantial variation exists in the number fewest births were reported for April (table15). Births peak histori- of births by day of the week. Daily averages ranged from 12,581 on callyinAugustandreachanadirinFebruary.Theaveragenumberof Tuesday to 8,052 on Sunday. births per month was 338,235. After standardizing the number of Variation in the daily pattern of births can also be measured by births for the number of days of the month, the number of births per anindexofoccurrence.Theindexisdefinedastheratiooftheaverage monthin2000washighestforAugustandlowestforApril(evenafter numberofbirthsperdayoftheweektotheaveragenumberofbirths taking into account that February had an extra day in 2000, a leap per day of the year with the base set at 100. In 2000 the index for year). Tuesdaywas113.4,indicatingthattherewere13.4percentmorebirths NationalVitalStatisticsReport,Vol.50,No.5,February12,2002 9 on Tuesday than the average day. As in past years, the index was Birth rates for unmarried women vary considerably by race lowest for Sunday (72.6), followed by Saturday (79.4). and Hispanic origin. The rate for Hispanic women was highest in A weekend ‘‘deficit’’ is apparent for both vaginal and cesarean 2000,97.3per1,000,followedbytherateforblackwomen,72.5,and deliveries,butisfargreaterforcesareandeliveries,particularlyrepeat theratefornon-Hispanicwhitewomen,27.9(tables17and18).The cesareans. The Sunday index for vaginal births in 2000 was 77.9, birthratefornon-Hispanicwhitewomenwasunchangedin2000from comparedwith63.9forprimarycesareans,and41.0forrepeatcesar- 1999,andhaschangedverylittlesince1994(28.5).Thebirthratefor eans.Thedeficitinbirthsbydayoftheweekandmethodofdelivery black women increased slightly in 2000 (from 71.5 in 1999), the first has increased since 1989 when these data first became available. increasesince1989.Despitetheincreasein2000,therateremained 20percent below its 1989 peak (90.7).The rate for Hispanic women had declined during 1994–98, and has since risen about 8percent. Births to unmarried women Birth rates for unmarried women are consistently highest for womenaged20–24years(74.5per1,000),followedbywomenaged All measures of childbearing by unmarried women increased in 18–19(62.9)and25–29years(62.2).Theratesforwomenintheirearly 2000 (tablesD, 17, and 18). The birth rate for unmarried women thirties and young teenagers are considerably lower, followed by increased 2percent to 45.2 births per 1,000 unmarried women aged womeninagegroups35yearsandover(tables17and18).Forthe 15–44 years. Despite this increase, the rate was still lower than the teenageyears,ratesforblackandHispanicwomenarefairlysimilar, peak reached in 1994, 46.9 (table18). The number of births to but at ages 20 years and over, rates are considerably higher for unmarried women rose 3percent to 1,347,043, the highest number Hispanic women. ever reported. Most of the increase was due to the increased birth During1999–2000,birthratesforunmarriedwomendeclinedonly rate; the 1percent increase in the number of unmarried women forteenagers,apatternthathasgenerallybeenobservedsince1994. contributed as well. During the 1990–2000 decade, the number of The rate for young teenagers declined 4percent to 24.4 per 1,000 births increased 16percent altogether, a far slower pace than during whereas the rate for older teenagers dropped by about 1percent to the 1980s, when the total number rose 75percent and annual 62.9(figure3).Since1994,theserateshavefallen24and10percent, increases amounted to about 6percent. The percent of all births respectively(31).Between1999and2000,ratesforages15–19years that were to unmarried women rose to 33.2percent in 2000, fell4percentfornon-Hispanicwhiteteenagersand2percentforblack compared with 33.0percent in 1999 and 28.0percent in 1990. teenagers;therateforHispanicteenagersincreasedabout1percent. Proceduresforreportingthemother’smaritalstatushavenot Birthratesforunmarriedwomeninagegroups20–24yearsand changedinanyStatesince1998.Inearlieryears,thesechangeshad older all increased in 2000, by 2 to 3percent for women in their contributedtothetrendsandvariationsinnonmaritalchildbearing.In twenties,and4percentforwomenintheirthirties.Therateforwomen 2000allStatesexceptforMichiganandNewYorkreportedthemother’s aged 40–44 years also rose in 2000. The largest increases in these maritalstatusthroughadirectquestiononthebirthcertificateorinthe age groups were reported for Hispanic women. electronicbirthregistrationprocess.MichiganandNewYorkinferthe Theproportionofallbirthsthatoccurredtounmarriedwomen mother’s marital status on the basis of other information on the birth was 22.1percent for non-Hispanic white women, unchanged from certificate; see Technical notes. Table D. Number, rate, and percent of births to unmarried women, and birth rate for married women: United States, 1980 and 1985–2000 Birthstounmarriedwomen Birthratefor Year Number Rate1 Percent2 marriedwomen3 2000. . . . . . . . 1,347,043 45.2 33.2 89.3 1999. . . . . . . . 1,308,560 44.4 33.0 86.5 1998. . . . . . . . 1,293,567 44.3 32.8 85.7 1997. . . . . . . . 1,257,444 44.0 32.4 84.3 1996. . . . . . . . 1,260,306 44.8 32.4 83.7 1995. . . . . . . . 1,253,976 45.1 32.2 83.7 1994. . . . . . . . 1,289,592 46.9 32.6 83.8 1993. . . . . . . . 1,240,172 45.3 31.0 86.8 1992. . . . . . . . 1,224,876 45.2 30.1 89.0 1991. . . . . . . . 1,213,769 45.2 29.5 89.9 1990. . . . . . . . 1,165,384 43.8 28.0 93.2 1989. . . . . . . . 1,094,169 41.6 27.1 91.9 1988. . . . . . . . 1,005,299 38.5 25.7 90.8 1987. . . . . . . . 933,013 36.0 24.5 90.0 1986. . . . . . . . 878,477 34.2 23.4 90.7 1985. . . . . . . . 828,174 32.8 22.0 93.3 1980. . . . . . . . 665,747 29.4 18.4 97.0 1Birthstounmarriedwomenper1,000unmarriedwomenaged15–44years. Figure 3. Birth rates for unmarried women, by age of 2Percentofallbirthstounmarriedwomen. mother: United States, 1980–2000 3Birthstomarriedwomenper1,000marriedwomenaged15–44years. 10 NationalVitalStatisticsReport,Vol.50,No.5,February12,2002 1999;itdeclinedfornon-Hispanicblackwomenfrom69.1to68.7per- over.Theeducationalattainmentofwomengivingbirth(basedonthe cent.AmongbirthstoHispanicwomen,theproportionincreasedfrom completed years of education at the time of birth) has increased 42.2 to 42.7percent (see tables13, 14, 17, and 19 for 2000 data). substantially over the last few decades. This trend reflects in part Themodestchangeintheproportionofbirthstounmarriedwomen increasesineducationalattainmentofallwomenduringthattimeperiod istheresultofa1percentincreaseinbirthstomarriedwomenin2000, (32,33).Themedianeducationalattainmentforallmothers,however, onlythesecondincreasesince1990.Thebirthrateformarriedwomen wasunchangedfromtheprecedingyearat12.9yearsin2000(tabular in2000(89.3per1,000)washigherthaninanyyearsince1991(89.9) datanotshownforthisandearlieryears),buthasrisenfrom12.4since (tableD). Earlier in the 1990s, the proportion of births to unmarried 1970. womenchangedrelativelylittlebecauseofcompensatingchangesin Althoughtheoveralltrendineducationalattainmenthasbeenup, births and birth rates for unmarried and married women (31). During variations by race and ethnicity persist.Almost all Japanese women 1998–2000,theproportioncontinuedtoinchupbecausetheincreases giving birth in 2000 completed 12 years of school (98percent) in nonmarital births have been slightly larger than the increases in (table13) while only about half of Hispanic women completed high marital births. school(51percent)(table14).WhiletheoverallproportionofHispanic Thenumbersandproportionsofbirthstounmarriedwomen mothers with at least 12 years of schooling was comparatively low, byStatebyraceandHispanicoriginfor2000areshownintable19. variation among Hispanic subgroups was wide, ranging from 45per- Increases in the numbers far outpaced declines: Numbers rose in all centofMexicanmothersto88percentofCubanmothers.Thepercent but4States(Alaska,Maine,Pennsylvania,andVermont),theDistrict of non-Hispanic white and non-Hispanic black mothers having com- of Columbia, the Virgin Islands, Guam, and American Samoa. The pleted high school were 88 and 75, respectively (tables14 and 21). declines were modest except for a 3percent drop in Vermont, and declines of 7 to 8percent in the Virgin Islands and Guam. The pro- portionsincreasedin32StatesandPuertoRico,declinedin14States, Maternal lifestyle and health characteristics the District of Columbia, the Virgin Islands, and Guam, and were unchanged in 4 States andAmerican Samoa. Weight gain Maternal weight gain during pregnancy influences infant birth- Age of father weight(34).In1990theInstituteofMedicinepublishedguidelinesfor The birth rate per 1,000 men aged 15–54 years was 51.6 in weightgainduringpregnancyforsingletongestations,laterendorsed 2000 (table20), an increase of 2percent from 1999 (50.8). Birth by theAmericanAcademy of Pediatrics and theAmerican College of rates increased 1 to 5percent for men aged 20–49 years, were Obstetricians and Gynecologists (35). Based on the mother’s body stable for men aged 50 years and over, and decreased for males mass index (BMI), which is calculated from her prepregnancy weight under age 20 years. After declining 11percent between 1990 and and height, the guidelines recommend that women who are under- 1995, the overall birth rate for men has remained stable. weight (low BMI) gain 28 to 40 pounds, those who are of normal Themeanageoffatherswas29.8yearsin2000comparedwith weight (average BMI) gain 25 to 35 pounds, those who are 29.7in1999(tabulardatanotshown).Informationonageoffatheris overweight(highBMI),gain15to25pounds,andobesewomen,gain oftenmissingonbirthcertificatesofchildrenborntowomenlessthan not more than 15 pounds (35). However, it is recommended that 25yearsofageandunmarriedwomenaswell(31).In2000theage weight gain goals be tailored to individual needs (35). of father was not reported for 14percent of all births, 24percent of Studiessuggestthatweightgainwithintheseguidelinesisasso- birthstoallwomenunderage25years,and39percentofallnonmarital ciated with the best outcomes; these studies also suggest, however, births. In computing birth rates by age of father, births where age of thatmostmaternalweightgainisoutsideoftherecommendedranges father is not stated were distributed in the same proportion as births (36).Onlyinformationonmaternalweightgainiscollectedonthebirth whereageoffatherisstatedwithineach5-yearageintervalofmother. certificate;therefore,itisnotpossibletodeterminewhethertheweight This procedure avoids the distortion in rates that would result if the gain was within the recommendations for the mother’s BMI. relationshipbetweenageofmotherandageoffatherweredisregarded. In2000,64percentofwomengainedatleast26poundsduring Theproceduresforcomputingbirthratesbyageoffatheraredescribed pregnancy (table22). The median weight gain for all mothers was in more detail in the Technical notes. 30.5pounds,whichhaschangedonlyslightlysince1989.Althoughthe medianweightgainhasremainedstable,thepercentofmotherswho gainedateitherendoftheweightgainspectrumhasincreased.In2000 Educational attainment thepercentofmotherswhogainedlessthan16pounds(11.6)andthe The educational attainment of women is important because percentwhogained46poundsormore(12.4)washigherthanin1989 higher educational attainment has been shown to be associated with (9.4and9.1,respectively).Highmaternalweightgainduringpregnancy more timely receipt of prenatal care and fewer lifestyle and health has been associated with an elevated risk of delivering a large- for- behaviorsduringpregnancythatcanbedetrimentaltobirthoutcome. gestationalage(LGA)infant,aswellasanincreasedriskofcesarean In2000,78percentofwomenwhogavebirthhad12ormoreyears delivery (37, 38). ofschooling(ahighschooleducation),and25percenthad16ormore Overall, maternal weight gain varied by period of gestation years of schooling (4 years of college) (table21). Since 1990, these (table22). In 2000 mothers who had preterm infants (gestations of proportionshaveincreased3and40percent,respectively.Thepercent under37completedweeks)hadamedianweightgainof28.0pounds, of mothers with at least a high school education generally increased almost3poundslessthanmotherswhohadbabieswithgestationsof withmaternalage,toabout90percentforwomenaged30yearsand 37to39weeks(30.5)or40weeksandover(30.9pounds).Themedian
Description:The list of books you might like

Corrupt (Devil's Night #1)

The 48 Laws of Power

Haunting Adeline

Shatter Me Complete Collection (Shatter Me; Destroy Me; Unravel Me; Fracture Me; Ignite Me)

Évaluations formative et certificative des apprentissages

Hindi Kahanikaro Ke Kathachintan Ke Sandrabh Main Unke Kahani Sahitya Ka Mulyakan
DTIC ADA442146: Performance of Polymer-Encased Concrete Walls Subjected to Blast Loads

Sanskritik Binimay Aru Sanhati

aquatic weeds in the sudan

Warning Order - Issue #16
Distribution and population size of Chapin’s Flycatcher Muscicapa lendu in Kakamega Forest, Kenya

Lord Tedric by Edward E Smith Ph D

2008 Benjamin Menschel Fellowship exhibition catalog
Juvenile delinquency intervention program, Youth Services Division, Department of Corrections, Judicial Branch : performance audit

DTIC ADA449060: Optimized Hyperthermia Treatment of Prostate Cancer Using a Novel Intracavitary Ultrasound Array
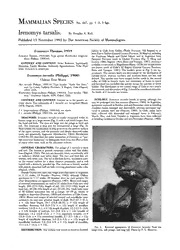
Irenomys tarsalis

The Philosophy of Ontological Lateness

Detroit: A Biography

Community-Acquired Pneumonia
Greek Government Gazette: Part 1, 2006 no. 42
