ERIC ED403690: Chartbook on Disability in the United States, 1996. PDF
Preview ERIC ED403690: Chartbook on Disability in the United States, 1996.
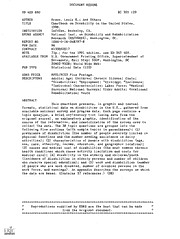
DOCUMENT RESUME EC 305 129 ED 403 690 AUTHOR Kraus, Lewis E.; And Others Chartbook on Disability in the United States, TITLE 1996. InfoUse, Berkeley, CA. INSTITUTION National Inst. on Disability and Rehabilitation SPONS AGENCY Research (ED/OSERS), Washington, DC. REPORT NO ISBN-0-16-048797-8 PUB DATE 96 H133D50017 CONTRACT 71p.; For the 1991 edition, see ED 345 405. NOTE U.S. Government Printing Office, Superintendent of AVAILABLE FROM Documents, Mail Stop: SSOP, Washington, DC 20402-9328; World Wide Web: Statistical Data (110) PUB TYPE MF01/PC03 Plus Postage. EDRS PRICE Adults; Age; Children; Chronic Illness; Costs; DESCRIPTORS *Disabilities; *Employment; *Etiology; *Incidence; *Individual Characteristics; Labor Force; *Medical Services; National Surveys; Older Adults; Vocational Rehabilitation; Youth ABSTRACT This chartbook presents, in graphic and textual formats, statistical data on disabilities in the U.S., gathered from available national survey and program data. Each page contains a topic ques,p,on, a brief_ exr1.?natory text (using data from the original source), an explanatory graphic, identification of the source of the information, and identification of the survey used to collect the data. The 38 topic questions are grouped into the following five sections (with sample topics in parentheses): (1) prevalence of disabilities (the number of people severely limited in physical functions and the number needing assistance in daily (2) characteristics of people with disabilities (age, activities); sex, race, ethnicity, income, education, and geographic location); (3) causes and medical cost of disabilities (the most common chronic health conditions which cause activity limitation and costs for (4) disability in the elderly and children/youth medical care); (incidence of disabilities in elderly persons and number of children who receive special education); and (5) work and disabilities (number of people who are work disabled, number of disabled persons in the work force, and earnings). An appendix describes the surveys on which the data are based. (Contains 37 references.) (DB) *********************************************************************** Reproductions supplied by EDRS are the best that can be made from the original document. *********************************************************************** C7\ VD C) "zzl- C) T-1-) U.S. DEPARTMENT OF EDUCATION -Office of Educational Research and Improvement EDUCATIONAL RESOURCES INFORMATION CENTER (ERIC) This document has been reproduced as UNOTIEZ STATI'S ceived from the person or organization originating it. Minor changes have been made to improve reproduction quality. Points of.view_or opinions stated in this document do not necessarily represent official OERI position or policy. HaVonall Unstatute on DD risab5Ofity and RehabiiRaVon Research ST Pt AVA1 E 2 Chartbook on Disability in the United States, 1996 Prepared by: Lewis E. Kraus Susan Stoddard, Ph.D. David Gilmartin InfoUse 2560 Ninth Avenue, Suite216 Berkeley, CA 94710 (510) 549-6520 Prepared for: U.S. Department of Education # H133D50017 National Institute on Disability and Rehabilitation Research Washington, DC 3 Suggested Citation Kraus, Lewis E., Stoddard, Susan, and Gilmartin, David (1996). Chartbook on Disability in the United States, 1996. An Info Use Report. Washington, DC: U.S. National Institute on Disability and Rehabilitation Reserch. 4 Info Use, 1996 Chartbook on Disability in the United States Foreword Our statutory charge at the National Institute on Disability and Rehabilitation Research (NIDRR) is to support research in order to maximize the self- sufficiency of individuals with disabilities of all ages. NIDRR has a leadership role in improving federal disability data, and in making the data more available. Demographic data and statistical information on disability contribute to the understanding of the scope of disability issues in the United States, developing disability policy, and planning, conducting, and evaluating services for individuals with disabilities. But the variety of statutory authorities for the collection of public data sets, and an inconsistently applied definition of disability have resulted in fragmented, incomplete, and inconsistent data sets about individuals with disabilities. Legislators, policymakers, service providers, the press, manufacturers, retailers, and advocates require information on the incidence and prevalence of disability conditions, the distribution of disability conditions among the population, and the characteristics of individuals with disabilities. To address the need for better use of disability statistics, NIDRR has identified the need for presentation of data in meaningful, understandable, and accessible formats usable by persons with a range of educational levels and technical skills, sensory disabilities, languages, and cognitive disabilities. This Chartbook on Disability in the United States, 1996, a product of NIDRR's new Center on Improving Access to Disability Data at InfoUse, is designed to provide current data in answer to many frequently asked questions about disability. The Chartbook is available in print and on the. World Wide Web. Katherine D. Seelman, Ph.D., Director National Institute on Disability and Rehabilitation Research 5 Chartbook on Disability in the United States Info Use, 1996 6 For sale by the I.J.S. Government Printing Office Superintendent of Documents, Mail Stop: SSOP, Washington, DC 20402-9328 0-16-048797-8 ISBN Chartbook on Disability in the United States Info Use, 1996 Preface The Chartbook on Disability in the United States, 1996, is a reference on disability in the U.S. population. We have created it for use by nontechnical and technical audiences alike. The book is a resource for agencies, organiza- tions, employers, researchers, and others needing to know about those people in the population who have a disability. Each page contains a topic question, explanatory text on the topic, and an explanatory graphic (or table) that provides data in an easy-to-read form. The source of the information and the survey used to collect the data appear at the bottom of the page. The surveys have a technical summary located in the appendix. In the text, key terms are shown in boldface and are defined in the glossary at the end of the book. Topic question Boldface terms How do the states differ in numbers of people with work disabilities? are defined in States where the proportion of persons age 16-64 with work disabilities is the the glossary highest are concentrated in the southern United States. The top 10 states (and District of Columbia) in percentage of disabled working age persons are: (1) West Explanatory text, Virginia (12.6 %); (2) Kentucky (11.4 %); (3) Arkansas (11.1%); (4) Mississippi (11.0%); (5) Louisiana (10.3%); (6) Oklahoma (10.2%); (7) Maine (10.2%); (8) Oregon (10.0 %); using data from (9) Tennessee (9.7%); and (10) Montana and Alabama (9.7%). The states (and District of Columbia) with the lowest proportions of work disabilities are: (51) New original source Jersey (6.2%); (50) Connecticut (6.4%); (49) HaWaii (6.6%); (48) Alaska (6.6%); (47) Illinois (6.9%); (46) North Dakota (7.0%); (45) & (44) Nebraska and Maryland (7.1%); and (43) & (42) Kansas and Massachusetts (7.2%). States with the largest increases in this rate from 1980 to 1990 are Alaska (up 22.0 percent from 5.4 percent in 1980 to 6.6 percent in 1990), Montana (up 19.3%), Wyoming (up 18.4%), Hawaii (up 11.4%) and Colorado (up 8.3%). States with the largest decreases in work disability from 1980 to 1990 are District of Columbia (down 15.0%), Florida (down 12.8%), Arkansas (down 12.2%), Maryland (down 11.9%) and Virginia (down 10.6%). Source of the Explanatory The highest rates of disability occur in the South. analysis by author graphic, created name, agency title, or with data from publication name; original source complete citations in the bibliography Survey or data source; surveys are explained in the Source: LaPlante and Cyril, Disability Statistics Abstract #6, 1993 Survey: 1990 Census of Population and Housing appendix. 9EST COPY WALE 7 iii Chartbook on Disability in the United States Info Use, 1996 Contents Foreword Preface iii Contents iv Introduction 1 SECTION 1- Prevalence of Disabilities 3 How many people have a disability? 4 How many people are severely limited in physical functions? 6 How many people need assistance in daily activities? 7 How many people have mental retardation? 8 How many people have a mental disorder? 9 SECTION 2 - Characteristics of People With Disabilities 11 Where do people with activity limitations live? 12 How many people use assistive technology devices? 13 How many people use home accessibility features? 14 How do activity limitations differ by age? 15 How do the levels of disabilities change with age? 16 How does activity limitation differ for males and females? 17 How do disability rates differ for males and females? 18 How does disability differ for races and ethnicities? 19 How does the need for assistance differ by race and ethnicity? 20 How do activity limitations differ by family income? 21 How do functional limitations differ by income? 22 How do activity limitations differ by educational level? 23 How does the need for assistance differ by educational level? 24 SECTION 3 - Causes and Medical Cost of Disabilities 25 Which chronic health conditions cause activity limitation most often? 26 In a year, which conditions causing activity limitations are reported most often? 27 How much do people with disabilities spend for medical care? 28 SECTION 4 - Disability, the Elderly, Children and Youth 29 How many elderly persons have disabilities? 30 How many older people need assistance with activities of daily living? 31 How many children have limitations in activity? 32 What are the differences in race and income for children with limitations? 33 How many children and youth receive special education? 34 Where do children and youth receive special education? 35 iv Chartbook on Disability in the United States Info Use, 1996 SECTION 5 - Work and Disabilities 37 How many people are considered to be work disabled? 38 How many disabled persons are in the labor force? 39 How many work disabled persons are working full-time? 40 How has the number of disabled people in the labor force changed over time? 41 How do the states differ in numbers of people with a work disability? 42 How many persons have a severe work disability? 43 How many people are limited or unable to work because of a health condition? 44 What chronic health conditions are the most frequent causes of work limitation? 45 How do occupational injuries and illnesses affect work disability? 46 47 What are the earnings of someone with a work disability? 48 How many people does the Vocational Rehabilitation system help? 49 Glossary Bibliography 54 59 Appendix 64 Acknowledgments 9 Info Use, 1996 Chartbook on Disability in the United States Introduction This 1996 edition of the Chartbook updates basic and current disability statistics. The presentation is nontechnical and meant for people who are interested in data on disability in the United States, but who are not familiar with the statistical sources. The document is intended for distribution in print and on the "Web." This book's approach uses the most generalizable data possible from available national survey and program data. These data are considered by experts to provide the best national estimates of disability. In the Chartbook, we report analyses from more than one survey, since surveys use different definitions of disability. All charts are prepared from published tables and documents. Each term which is uniquely defined by the surveys is bold-faced on the page and is defined in the Glossary. Each page notes the survey and source of analysis. A Bibliography provides references for the sources consulted. Detailed information covering technical issues of each survey is provided in the Appendix. Section 1 provides estimates of people with disabilities in the United States. Section 2 reviews the data on characteristics (age, sex, race, ethnicity, income, education, geographic location) of people with disabilities as reported by national surveys. Causes of disabilities, and medical costs, are covered in Section 3. Section 4 examines aspects of two particularly important disability populations, the elderly and children. Finally, work disability is reviewed in Section 5. 1 0 1
The list of books you might like

Can’t Hurt Me: Master Your Mind and Defy the Odds

The Mountain Is You

The Subtle Art of Not Giving a F*ck

Better Than the Movies

Алгебра. 8 класс
DTIC ADA445281: Guide for Preparing Technical Information Reports of the Engineer Research and Development Center
Exhibition - CMA@MOCA

IFRS 15 investment management companies

August 2016 PART I

byle s lie Pine ada
Greek Government Gazette: Part 2, 2013 no. 63

Экологический практикум. 5(6) класс

böwö dalam perkawinan suku nias departemen antropologi sosial

Daireen complete by Frank Frankfort Moore

Guerra Contra Todos los Puertorriqueños: Revolución y Terror en la Colonia Americana (Spanish Edition)

Lutheran Education Mar/Apr 1993

DC 1:2012cv00139 complaint attachment 5
ERIC ED370582: Visualizing Technology: An Analysis of Preservice Teacher's Classroom Maps.

Allgemeine Psychologie I

