water quality data weekly 20180107 PDF
Preview water quality data weekly 20180107
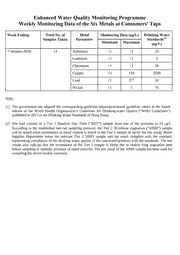
Enhanced Water Quality Monitoring Programme Weekly Monitoring Data of the Six Metals at Consumers' Taps Week Ending Total No. of Metal Monitoring Data (μg/L) Drinking Water Samples Taken Parameter Standards(1) Minimum Maximum (μg/L) 7-January-2018 14 Antimony <1 <1 20 Cadmium <1 <1 3 Chromium <1 <1 50 Copper <3 110 2000 Lead <1 5(2) 10 Nickel <1 5 70 Note: (1) The government has adopted the corresponding guideline values/provisional guideline values in the fourth edition of the World Health Organization’s Guidelines for Drinking-water Quality (“WHO Guidelines”) published in 2011 as the Drinking Water Standards of Hong Kong. (2) The lead content of a Tier 1 Random Day Time (“RDT”) sample from one of the premises is 14 µg/L. According to the established two-tier sampling protocol, the Tier 2 30-minute stagnation (“30MS”) sample will be tested when exceedance in metal content is found in the Tier 1 sample to verify the test result. Water Supplies Department tested the relevant Tier 2 30MS sample and the result complies with the standard, representing compliance of the drinking water quality of the concerned premises with the standards. The test results also indicate that the exceedance of the Tier 1 sample is likely due to unduly long stagnation time before sampling or sporadic presence of metal particles. The test result of the 30MS sample has been used for compiling the above weekly summary.
