Three Essays on the College Admissions Process by Daniel M. Leeds PDF
Preview Three Essays on the College Admissions Process by Daniel M. Leeds
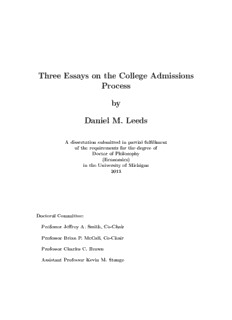
Three Essays on the College Admissions Process by Daniel M. Leeds A dissertation submitted in partial fulfillment of the requirements for the degree of Doctor of Philosophy (Economics) in the University of Michigan 2013 Doctoral Committee: Professor Jeffrey A. Smith, Co-Chair Professor Brian P. McCall, Co-Chair Professor Charles C. Brown Assistant Professor Kevin M. Stange To my family and to Rachel, for their constant love and support. ii I would like to thank Dan Ackerberg, Emily Beam, Charlie Brown, Emily Collins, Lindsay Daugherty, Steve DesJardins, John DiNardo, Sue Dynarski, Rachel Ezzell, Rob Garlick, Jesse Gregory, Brad Hershbein, Chris House, Bob Hunt, Josh Hyman, BrianJacob, HyunjeeKim, EvaLeeds, MichaelLeeds, PacoMartorell, BrianMcCall, Isaac McFarlin, Edie Ostapik, Jeff Smith, Kevin Stange, Jacob Vigdor, Elias Walsh, Ophira Vishkin, Laura Zimmermann, participants at Michigan’s Labor Lunch and Causal Inference in Education Research Seminars and at the MEA conference, and any others whom I have not mentioned above for their advice and assistance, without which this would have been impossible. iii Table of Contents Dedication ii Acknowledgements iii List of Tables vi List of Figures ix Introduction 1 Chapter 1: The Impact of Admissions Policies and Test Prep on SAT Scores 5 Introduction 6 Background and Literature 11 Model 18 Data 28 Simulations 35 Results 37 Conclusion 44 Chapter 2: Does Student Effort Respond to Incentives? Evidence from Automatic College Admissions 61 Introduction 62 The Texas Top Ten Percent Law 65 iv Literature and Background 68 Regression Discontinuity 72 Data 77 Results 82 Conclusion 93 Chapter 3: Iowa’s National Scholars Award and the Efficiency of Merit Aid: A Regression Discontinuity Analysis 118 Introduction 119 Background and Literature 121 Model and Theory 125 Data 132 Results 136 Conclusion 144 Appendix: Flagship Characteristics 163 v List of Tables Table1.1: Summary Statistics by Tests Taken 49 Table 1.1.A: Demographics 49 Table 1.1.B: Expectations 49 Table 1.1.C: College Outcomes 50 Table 1.1.D: Prep Usage 50 Table 1.2: Summary Statistics by PSAT Score Reporting 51 Table 1.2.A: Demographics 51 Table 1.2.B: Expectations 51 Table 1.2.C: College Outcomes 52 Table 1.2.D: Prep Usage 52 Table 1.3: SES and SAT Sittings by PSAT Score Reporting 53 Table 1.3.A: Socioeconomic Quartiles 53 Table 1.3.B: Observed SAT Sittings 53 Table 1.4: Prep Usage by SES Quartile 53 Table 1.5: Data Moments 54 Table 1.6: Fixed Values 54 Table 1.7: Calibrated Parameter Values 55 Table 1.8: Moment Matching 56 vi Table 1.8.A: Score Moment Matching 56 Table 1.8.B: Behavioral Moment Matching 56 Table 1.8.C: Overall 56 Table 1.9: Counterfactual Outcomes 57 Table 1.9.A: Counterfactual Testing 57 Table 1.9.B: Counterfactual Applications 57 Table 1.9.C: Counterfactual Costs 58 Table 1.9.D: Score Accuracy 58 Table 2.1: Continuity of Student Characteristics 105 Table 2.2: First-Stage Outcomes 105 Table 2.3: Probability of Obtaining at Least a Recommended-Level Diploma 106 Table 2.4: Probability of Obtaining a Distinguished-Level Diploma 107 Table 2.5: Number of Courses Taken in 12th Grade 108 Table 2.6: Difference in Courses Taken 109 Table 2.7: Number of Credits Taken in 12th Grade 110 Table 2.8: Difference in Credits Taken 111 Table 2.9: 12th Grade GPA 112 Table 2.10: 12th Grade GPA (1st Semester Only) 113 Table 2.11: 12th Grade GPA (2nd Semester Only) 114 Table 2.12: Difference in GPAs 115 Table 3.1: Summary Statistics 155 Table 3.2: RD Estimates Without Additional Covariates 156 vii Table 3.2.A: 2009-2011 Pooled 156 Table 3.2.B: 2005-2008 Pooled 157 Table 3.2.C: 2004 158 Table 3.3: RD Estimates With Additional Covariates 159 Table 3.3.A: 2009-2011 Pooled 159 Table 3.3.B: 2005-2008 Pooled 160 Table 3.3.C: 2004 161 Appendix: Flagship Characteristics 163 viii List of Figures Figure 1.1: 2-Test VC Model 46 Figure 1.2: 2-Test Leeds Model 47 Figure 1.3: Maximization Problems 48 Figure 2.1: Enrollment 96 Figure 2.2: Recommended or Distinguished Diplomas 97 Figure 2.3:Distinguished Diplomas 98 Figure 2.4: Classes Taken 99 Figure 2.5: Difference in Classes Taken 100 Figure 2.6: Honors/AP Credits Taken 101 Figure 2.7: Difference in Honors/AP Credits Taken 102 Figure 2.8: Senior Year GPA 103 Figure 2.8: Difference in GPA 104 Figure 3.1: Award Comparison Rate 148 Figure 3.2.A: McCrary Density Tests, 2009-2011 149 Figure 3.2.B: McCrary Density Tests, 2005-2008 150 Figure 3.2.C: McCrary Density Tests, 2004 151 Figure 3.3: RAI Graphs, Bandwidth 30 152 ix Figure 3.4: AIS Flat Rate Graphs, Bandwidth 20 153 Figure 3.5: AIS Tiered Graphs, Bandwidth 10 154 x
Description: