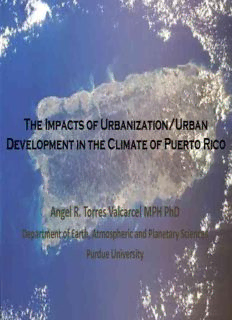
The Impacts of Urbanization/Urban Development in the Climate of Puerto Rico Angel R. Torres ... PDF
Preview The Impacts of Urbanization/Urban Development in the Climate of Puerto Rico Angel R. Torres ...
The Impacts of Urbanization/Urban Development in the Climate of Puerto Rico Angel R. Torres Valcarcel MPH PhD Department of Earth, Atmospheric and Planetary Sciences Purdue University Abstract A detailed analysis of century-scale climate change for Puerto Rico was done to assess the degree to which some of this change might be related to LULCC. We used long-term data, Geographic Information Systems (GIS), statistical analysis and Regional Atmospheric Modeling Systems (RAMS) to detect and assess the impact of local urban development on temperature and precipitation. We found strong evidence of a relationship linking temperature and precipitation magnitudes to local urban development. Findings for maximum, average and minimum temperature are robust showing that urbanization has increased local temperatures and levels of impact found here represent minimum estimates since they were based on data that had some prior adjustment intended to control for urban signals. Strong evidence of this relationship was also found in the precipitation data analysis, but no clear correlation was found in the direction, magnitude, period and location of rain with urban development implying that other factors dominate or are playing some role in this relationship. RAMS numerical modeling results were inconclusive suggesting that further tuning of settings and parameters are needed before model results can be used to guide decision-making. © Angel R. Torres Valcárcel, 2013 Dissertation Research • 1st part (Statistical Analysis) – Long term observational study • Temperature (Maximum, Average and Minimum) • Precipitation (Monthly Average, Yearly Total Average) • 2nd part (Computer simulations) – Computational experiments • Regional Atmospheric Modeling System (RAMS) – Precipitation computer simulations © Angel R. Torres Valcárcel, 2013 Study Questions I.Long Term Observational Study A.Have urbanization / urban development impacted local temperatures?, if so… i. What is the magnitude of the temperature impacts? B.Have urbanization / urban development impacted precipitation quantities?, if so… i. What is the magnitude of the precipitation impacts? II. Computational Experiments A. What are the major land features and processes controlling local precipitation events? © Angel R. Torres Valcárcel, 2013 Previous Work • Land Use / Land Cover Change – Forest Regeneration – Urban Heat Island (UHI) in San Juan • Temperature – Parameter-elevation on Independent Slopes Model (PRISM) – Climate Change Scenarios – RAMS • Precipitation – PRISM – Rain Regionalization – RAMS • Vegetation – Holdridge Ecological Life Zones (HELZ) – Puerto Rico GAP © Angel R. Torres Valcárcel, 2013 Data & Methods • Digital Maps – Land use / Land cover (Puerto Rico GAP Project 2004) – Holdridge Ecological Lifezones (HELZ) • Long term weather station data – Temperature (adjusted) – Precipitation (raw) • Geographic Information Systems (GIS) • Statistical Analysis (ANOVA, T-test; α =0.05 ) • Regional Atmospheric Modeling System (RAMS) © Angel R. Torres Valcárcel, 2013 Holdridge Ecological Lifezones • Geo-climatic plant classification system • Uses physiographic, climatic and physiological characteristics of plants – Elevation – Precipitation – Humidity – Potential evapotranspiration • Water availability for ecosystem function – Bioemperature • Range of temperatures for vegetation grow (0°C to 30 °C) Holdridge, 1967 Holdridge Ecological Lifezones Holdridge, 1967 Puerto Rico Holdridge Ecological Lifezones, urban areas and weather stations. . Legend Stations 0 5 10 20 30 40 Heavy Urban 2004 Miles HELZ Legend Holdridge Ecological Lifezones Stations Dry Forest Heavy Urban 2004 Moist Forest Lower Montane Rain Forest HELZ Subtropical Rain Forest Holdridge Ecological Lifezones Lower Montane Wet Forest Dry Forest Subtropical Wet Forest Moist Forest costa Lower Montane Rain Forest Subtropical Rain Forest Lower Montane Wet Forest Subtropical Wet Forest costa HELZ Temperature Data Analysis Maximum Temperature Average Temperature Minimum Temperature HELZ Station Data Station Data Station Data Decadal (°C) Sig. (°C) Sig. (°C) Sig. Wet Forest 27.19 0.000 22.26 0.000 17.33 0.000 Moist Forest 30.41 0.315 25.41 0.000 20.41 0.000 Dry Forest 30.66 0.315 26.12 0.000 21.58 0.000 HELZ GIS GIS GIS Century (°C) Sig. (°C) Sig. (°C) Sig. Wet Forest 28.16 0.000 23.07 0.000 17.98 0.000 Moist Forest 29.25 0.000 24.54 0.000 19.84 0.000 Dry Forest 29.86 0.000 25.37 0.000 20.87 0.000 α =0.05 © Angel R. Torres Valcárcel, 2013
Description: