The AB=CD Pattern PDF
Preview The AB=CD Pattern
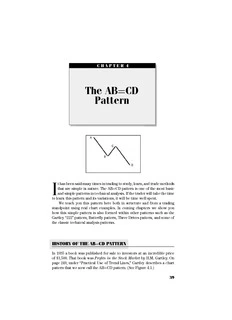
c04 JWPR033-Pesavento(WileyTradingSeries) August14,2007 13:3 CharCount= C H A P T E R 4 = The AB CD Pattern Ithasbeensaidmanytimesintradingtostudy,learn,andtrademethods thataresimpleinnature.TheAB=CDpatternisoneofthemostbasic andsimplepatternsintechnicalanalysis.Ifthetraderwilltakethetime tolearnthispatternanditsvariations,itwillbetimewellspent. We teach you this pattern here both in structure and from a trading standpoint using real chart examples. In coming chapters we show you how this simple pattern is also formed within other patterns such as the Gartley“222”pattern,Butterflypattern,ThreeDrivespattern,andsomeof theclassictechnicalanalysispatterns. HISTORY OF THE AB=CD PATTERN In 1935 a book was published for sale to investors at an incredible price of $1,500. Thatbook was Profits in the Stock Market byH.M.Gartley.On page 249, under “Practical Use of Trend Lines,” Gartley describes a chart patternthatwenowcalltheAB=CDpattern.(SeeFigure4.1.) 39 c04 JWPR033-Pesavento(WileyTradingSeries) August14,2007 13:3 CharCount= 40 TRADEWHATYOUSEE Figure 4.1 Illustration of the Parallel Trend Lines chart found in H.M. Gartley’s book,ProfitsintheStockMarket (1935). Courtesy of Lambert Gann Publishing. P.O. Box 0, Pomeroy, WA 99347. www. wdgann.com. Thispatternhasappearedinanotherwork,onebyFrankTubbs.Tubbs offered a correspondence course in the 1950s called The Frank Tubbs Stock Market Course. This course was based on the pattern that Gartley hadexplainedinhis1935book. Tubbs used many charts from the 1920s and 1930s in his description ofthepatternandbroughttheworkforwardintothe1950s,validatingthis classicpattern.CharlesLindsayalsousedthispatterninhisbookTrident: A Trading Strategy written in 1976. Lindsay identified trends as micro, minor,intermediate,andmajor.Heillustratedthattheparallelpriceswings were apparent on all charts and in all time frames. The system described wasidenticaltoGartley’spattern.LindsaylabeledhispatternwithP1,P2, P3,andP4,whichwerenothingmorethanA,B,C,andD. LindsaytooktheAB=CDpatternandmadeitintoaformulathatwould givethepatternacompletiontargetatD(P4),sotheformulawouldbe: P2+P3 P4= P1 Thisisequivalentto: B+C D= A HethencameupwithaformulathatsaidP3shouldbearatioof.625 ofP1toP2.Thisisequivalenttoa.618retracementbytheBClegfromthe ABswing.(SeeFigure4.2.)Hetook25percentoftheP1orthefirstlegas ariskfactor. c04 JWPR033-Pesavento(WileyTradingSeries) August14,2007 13:3 CharCount= TheAB=CDPattern 41 Figure 4.2 Merck (MRK) daily chart showing AB=CD pattern with .618 retrace- ment of the AB leg. This is similar to Lindsay’s .625 retracement of the P1 to P2 leg. AB=CD PATTERN DESCRIPTION Gartley’s description of the AB=CD pattern illustrated how the market would rallyinanuptrend and thenretrace. Itwould then rallytoanother uptrend then make another retracement, forming an upsloping parallel channel.ItwasfromthisdescriptionthattheAB=CDpatternachievedits nickname,thelightningbolt.(SeeFigure4.1.) Gartley spent several pages referring to these trend lines and parallel lines as excellent signals when used in conjunction with other working tools.Healsoappliedtheselinestopriceratios.Heusedmainlyratiosof one-thirdandone-halfforretracements. AB=CD PATTERN STRUCTURE The AB=CD pattern isfound inall markets and all timeframes. This pat- tern is the foundation for the Gartley buy and sell patterns (discussed in Chapter 5). It is also an integral part of the Butterfly pattern (Chapter 6) andalsoformsapartoftheThreeDrivespattern(Chapter7).Thepattern c04 JWPR033-Pesavento(WileyTradingSeries) August14,2007 13:3 CharCount= 42 TRADEWHATYOUSEE isameasuredmovewheretheCDlegissimilarinlengthtotheABleg.It shouldbenoted,though,thattheCDlegcanextendandwillnotalwaysbe exactlyequaltotheABleg;thisisdiscussedin“ImportantCharacteristics oftheAB=CDPattern”laterinthischapter.Figure4.3showstheshapeof thebasicAB=CDbuyandsellpatterns. There are three legs that form this pattern. (See Figure 4.4.) The first legofthepatternislabeledAB.Afterthecompletionofthefirstleg,are- tracementorcorrectionoccursthatwillusuallyfindsupportorresistance at one of these Fibonacci levels: .382, .50, .618, or .786. This correction or retracement is labeled BC and is the second leg of the pattern. (Note: Strongly trending markets will usually see only a retracement to the .382 level. See the chart in the “Slope and Time Frames” section later in the chapterforanexampleofashallowretracementatthe.382level.) Figure 4.3a BasicstructureoftheAB=CDpattern,illustratingthe“lightningbolt” shapeofthebuyandsellpatterns. Figure 4.3b AB=CDbuyandsellpatternswithS&PE-minichartprice. c04 JWPR033-Pesavento(WileyTradingSeries) August14,2007 13:3 CharCount= TheAB=CDPattern 43 Figure 4.4 Merck(MRK)dailychartshowingcompletedAB=CDpattern.Thispat- tern completion leads to retracements of the AD swing of almost all the main Fi- bonaccilevelsweuse. When price resumes in the same direction as the AB leg, the CD leg thenbeginstoform.OnceweidentifytheCDlegforming,wecanproject the potential pattern completion and devise a trading strategy. As the CD leg forms and completes, we monitor the final leg for any warning signs thatwouldalertustoachangeinmarketconditionsthatmaysignalusto possibly pass on the trade or wait for further confirmation before enter- ingthetrade.Chapter11,“TradeManagement,”coversthisinmoredetail. OncethepriceexceedsB,wemakeanassumptionthatthepricewillreach patterncompletionatpointD. When studying this pattern, it is important to know what invalidates the pattern. Here are three items that would invalidate the AB=CD pat- tern: 1. BCcannotexceedtheABleg,meaningtheretracementofABcannot exceed1.00. 2. BCcanbea1.00retracementoftheABleg;thisisararepatternanda doubletoporbottom,butitisavalidpattern. 3. DmustexceedBinorderforthepatterntocompleteatpointDandbe avalidAB=CDpattern.SeeFigure4.5asanexample. c04 JWPR033-Pesavento(WileyTradingSeries) August14,2007 13:3 CharCount= 44 TRADEWHATYOUSEE Figure 4.5 Euro daily chart. Once price exceeds B, we assume the pattern will completeatpointD. IMPORTANT CHARACTERISTICS OF THE AB=CD PATTERN About40percentofthetime,theAB=CDpatternwillbeperfectlysymmet- rical, meaning AB equals CD. The other 60 percent of the time variations of the pattern will be present. What this means is that after the AB leg has formed and the retracement leg, BC, has completed, the CD leg will be different from the AB leg. The two legs may or may not be perfectly symmetrical. SomeofthewaystheCDlegcanvaryfromtheABleginclude: Ĺ The CD leg is an extension of AB anywhere from 1.27 to 2.00 (or greater).SeeFigure4.6asanexample. Ĺ TheCDleghasaslopeoranglesteeperorwiderthanAB. At first glance this variation might make the trader think the pattern isnottradable.ThekeyliesinidentifyingtheBCleg.Themostimportant thing is to watch the price action coming after point C has formed. Many oftheexamplesthatyouwillseeinthischapterwillshowthattheCDleg determinestherelationshiptotheABleg. c04 JWPR033-Pesavento(WileyTradingSeries) August14,2007 13:3 CharCount= TheAB=CDPattern 45 Figure 4.6 Dailychartof30-yearbondsshowingAB=CDpatternwiththeCDleg extendingto1.27oftheABleg. CD LEG VARIATIONS TheseCDlegphenomenacanbedescribedinfourways: 1. If after point C has occurred a gap exists in the direction of point D, thisusuallyindicatesthattheCDlegwillbemuchgreaterthantheAB leg—1.272,1.618,ormore.SeeFigure4.7asanexample. 2. A wide range bar (twice normal size) at point C is another indication thattheCDlegcouldbecomeextended.SeeFigure4.8asanexample. 3. Ideally, AB=CD moves are symmetrical in price and time. For exam- ple,iftheABlegissixbarsup,thentheCDlegwillbesixbarsup.See Figure4.9asanexample. 4. AsillustratedinFigure4.10,thetimetoformthetwolegsissymmetri- cal. Thisnextsentenceisveryimportant:IftheCDlegismadeinjustafew bars,thisstronglyindicatesthattheCDlegisgoingtobeanexpansionof theABleg.SeeFigure4.11foranexampleofthis. Asanexampleofthisthrustprinciple,imaginehavingtwoFerrariauto- mobilesontheracetrack,onewithdieselfuelandtheotherwithhigh-tech c04 JWPR033-Pesavento(WileyTradingSeries) August14,2007 13:3 CharCount= 46 TRADEWHATYOUSEE Figure 4.7 ClassicAB=CDpatternonEOGResources(EOG)dailychartwithgap frompointCandsharpslopingdownmovetopointDsuggestsCDlegwillextend. Figure 4.8 Allthewarningsignsarepresentinthis120-minutechartoftheNAS- DAQfutures.(WarningsignsarediscussedinChapter11.)Noticethelongbarsas theCDlegisjustbeginningdown.ThisgivesthetraderanalertthattheCDlegmay beanextensionto1.272,1.618,orgreateroftheABleg. c04 JWPR033-Pesavento(WileyTradingSeries) August14,2007 13:3 CharCount= TheAB=CDPattern 47 Figure 4.9 EurocurrencydailychartshowingAB=CDpatternwithverysymmet- ricalsixbarsupintheABlegandsixbarsupintheCDleg. Figure 4.10 Google(GOOG)5-minutechartshowingtimeisalsoanelementin thesymmetryofthepatterns. c04 JWPR033-Pesavento(WileyTradingSeries) August14,2007 13:3 CharCount= 48 TRADEWHATYOUSEE Figure 4.11 A very long bar from the C turning point in this Intel (INTC) daily chartindicatesthattheCDlegwillbeanexpansionoftheABleg. gasoline. It would be easy to understand the Ferrari powered with high- techgasolinegettingtothefinishlinefirst.WatchtheCDleg,becauseifit startsfast,thatisthefasterFerrarigoingfurtherfaster. SLOPE AND TIME FRAMES The slope or time frame of the BC move can also be helpful in determin- ing the pattern. BC legs generally correct to one of the Fibonacci ratios: .382, .50, .618, or .786. The slope of this BC leg is usually a good indica- tionofwhatthenextCDlegwillbe.Forexample,assumethattheABleg took15tradingbarstoreachpointB,andnowtheBCleghastaken8bars buthasretracedonly.382percentoftheABleg.Thisisasignofthemar- ket absorbing a lot of selling at a high price; it is a shallow retracement, andthepricehasnotbeenabletoretraceto.50,.618,or.786percent.We wouldassumethatpriceswouldgomuchhigherandpossiblyquiterapidly once the selling slows. However, if the market retraces to a .618 or .786 retracement, the CD leg will most probably be a normal move equaling AB=CD.
Description: