Survey of Current Business 2012: Vol 92 Index & Table of Contents PDF
Preview Survey of Current Business 2012: Vol 92 Index & Table of Contents
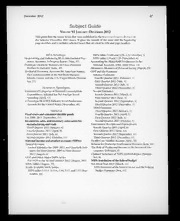
December 2012 Subject Guide VOLUME 92 JANUARY—DECEMBER 2012 This guide lists the major items that were published in the Survey or Current Business in the January—December 2012 issues. It gives the month of the issue and the beginning page number, and it includes selected boxes that are cited by title and page number. BEA Briefings NIPA tables 3.18B and 3.19—3.23 {October, 7} Modernizing and Enhancing BEA’s International Eco- NIPA tables 2.9 and 7.20 {November, 6} nomic Accounts: A Progress Report {M ay, 37} Accounting for Household Production in the Prototype Quarterly Statistics on Gross Domestic National Accounts, 1965-2010 {May, 23} Product by Industry {June, 49} Alternative Measures of Personal Saving {M arch, 23} ‘Territorial Economic Accounts for American Samoa, GDP and the Economy the Commonwealth of the Northern Mariana Advance Estimates Islands, Guam, and the U.S. Virgin Islands {Novem- Fourth Quarter 2011 {February, 1} ber, 27} First Quarter 2012 {May, 1} Second Quarter 2012 {July, 1} Research Spotlights Third Quarter 2012 {November, |} Estimates of Categories of Personal Consumption Second Estimates Expenditures Adjusted for Net Foreign ‘Travel Fourth Quarter 2011 {March, 1} Spending {April, 13} First Quarter 2012 {June, 1] A Prototype BEA/BLS Industry-Level Production Second Quarter 2012 {September, 1} Account for the United States {November, 44} Third Quarter 2012 {December, 1} Third Estimates National Third Quarter 2011 {January, 1} Fixed assets and consumer durable goods Fourth Quarter 2011 {April, 1} For 2008-2011 {September, 21} First Quarter 2012 {July, 1} Inventories, sales, and inventory-sales ratios for Second Quarter 2012 {October, 1} manufacturing and trade Government Receipts and Expenditures Third Quarter 2011 {January, 6} Fourth Quarter 2011 {April, 6} Fourth Quarter 2011 {April, 9} First Quarter 2012 {June, 11} First Quarter 2012 {July, 6} Second Quarter 2012 {September, 11} Second Quarter 2012 {October, 11} Third Quarter 2012 {December, 11} National income and product accounts (NIPAs) Health Care Satellite Account {June, 34} Annual Revision Returns for Domestic Nonfinancial Business {June, 14} Annual Estimates for 2009-2011 and Quarterly Esti- The Role of Profits and Income in the Statistical Dis- mates for First Quarter 2009 to First Quarter crepancy {February, 8} 2012 {August, 6} Updaied Summary of NIPA Methodologies {Novem- GDP and Other Major NIPA Series ber, 8} For 1929 to the Second Quarter 2012 {August, 183} NIPA translation of the federal budget NIPA ‘Tables {August, 32} For Fiscal Year 2013 {March, 11} Newly Available NIPA Tables NIPA Estimates of the Federal Sector and the Federal NIPA tables 3.15.1—3.15.6, 3.16, 3.17, and 7.15 {Sep- Budget Estimates |box, 13] tember, 14} Subject Guide 2012 December 2012 Industry U.S. international transactions Industry accounts Annual Estimates, 2011 {April, 30} Annual Industry Accounts How BEA Aligns and Augments Source Data From the Advance Statistics on GDP by Industry for 2011 U.S. ‘Treasury Department for Inclusion in the Inter- {May, 6} national Transactions Accounts {July, 47} Revised Statistics for 2009-2011 {December, 14} An Ownership-Based Framework of the U.S. Current Travel and tourism satellite accounts Account for 1999-2010 {January, 44} For 2003-2011 {June, 19} Quarterly Estimates Third Quarter 2011 {January, 10} international Fourth Quarter 2011 {April, 22} An Analysis of Revisions to BEA’s International Eco- First Quarter 2012 {July, 50} nomic Accounts {November, 76} Second Quarter 2012 {October, 60} Direct investment positions Country and Industry Detail for 2011 {July, 19} Regional Detailed Historical-Cost Positions and Related Finan- Gross domestic product by state cial and Income Flows for 2009-2011 {September, Advance Statistics for 2011 and Revised Statistics for 28} 1997-2010 {July, 101} Foreign direct investment in the United States Local area personal income Operations of U.S. Affiliates of Foreign Companies in For 2010 {May, 51} 2010 {August, 213} Regional price parities for states and metropolitan areas U.S. direct investment abroad For 2006-2010 {August, 229} Operations of U.S. Multinational Companies in Regional quarterly reports 2010 {November, 51} County Compensation by Industry for 2010 U.S. international investment position January, 52} Yearend 2011 {July, 9} State Personal Income U.S. international accounts Annual Estimates Annual Revision {July, 35} For 2011 {April, 61} International Transactions and Positions in Financial Quarterly Estimates Derivatives {July, 98} Third Quarter 2011 {January, 48} U.S. international services Fourth Quarter 2011 {April, 58} Profile of U.S. Exporters and Importers of Services First Quarter 2012 {July, 132} {June, 66} Second Quarter 2012 {October, 94} Cross-Border ‘Trade in 2011 and Services Supplied An Examination of Revisions to the Quarterly Esti- Through Affiliates in 2010 {October, 15} mates of State Personal Income {August, 243} ISSUES ARE NOT AN EXACT FACSIMILE OF THE ORIGINAL PUBLISHED ISSUE. SOME CONTENT MAY BE MISSING. THIS REPRODUCTION IS MADE FROM THE BEST COPY AVAILABLE
