Table Of ContentThe August 2017 Solar Eclipse
Carl Luetzelschwab K9LA September 2019
For the solar eclipse of August 21, 2017, Mike WB9NOO and I went to the elementary school
where my wife Vicky AE9YL teaches science. We brought a thermometer to measure the
outside air temperature as the eclipse progressed. We also monitored stations on five frequencies
to see what happened to the signal strength as the eclipse progressed.
Ft Wayne reached 88% totality at 2:26 PM (1826 UTC). Both of our experiments were set up
outside under the shade of a big tree, and several students participated in the measurements. We
used my Yaesu FT-747 for the receiver (the S-meter is calibrated in terms of dBm) with a 40m
Hamstick mounted on the roof of our van. Vicky rode herd over the temperature measurements,
and Mike and I rode herd over the radio reception measurements.
The frequencies monitored were WSCR in Chicago on 670 KHz, WLS in Chicago on 890 KHz
and WWV in Colorado on 5 MHz, 10 MHz and 15 MHz.
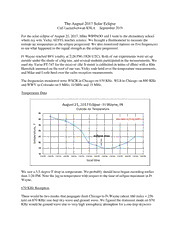
Temperature Data
We saw a 5.5 degree F drop in temperature. We probably should have begun recording earlier
than 1:20 PM. Note the lag in temperature with respect to the time of eclipse maximum in Ft
Wayne.
670 KHz Reception
There would be two modes that propagate from Chicago to Ft Wayne (about 160 miles = 256
km) on 670 KHz: one-hop sky-wave and ground wave. We figured the dominant mode on 670
KHz would be ground wave due to very high ionospheric absorption for a one-hop skywave
during the day. With ground wave, we expected little variation in signal strength due to the
eclipse.
We definitely heard WSCR throughout the entire measurement period. It appears that the signal
strength was quite constant, but the -101 dBm values (S3) from the FT-747 may be the noise
floor of our system in the AM mode. Unfortunately we didn’t tune to a clear channel to verify
this. The 4 dB drop around 1750 UTC was well before the eclipse maximum at the midpoint of
the path, and may have just been a short change in noise. Thus we may not have any reliable data
on 670 KHz.
890 KHz Reception
We figured ground wave would also dominate between Chicago and Ft Wayne on 890 KHz (but
the ground wave signal would not be as strong as on 670 KHz).
We heard WLS throughout the measurement period. The peak in signal strength at eclipse
maximum (to S4) at the midpoint of the path suggests that ionospheric absorption decreased
enough to allow the one-hop sky-wave mode to beat the ground wave mode.
5 MHz Reception
On 5 MHz, we figured the MUF (maximum useable frequency) would be high enough for this
1131 mile (1821 km) path, and we’d see a peak due to decreased ionospheric absorption.
Indeed, we saw a good increase in signal strength (to S6 and S5) beginning around the eclipse
maximum at the midpoint of the path.
10 MHz Reception
The 10 MHz results are interesting. The ups and downs suggest that:
1) the first dip in signal strength was due to either the MUF decreasing or ionospheric
absorption increasing
2) the peak in signal strength afterwards was due to either the MUF coming back up or
ionospheric absorption decreasing
3) the second dip in signal strength was due to either the MUF again decreasing or
ionospheric absorption again increasing
Ray tracing with ProplabPro V3 might resolve this, but I can’t modify the model of the
ionosphere in Proplab Pro for the eclipse scenario. Also, this may have been a two-hop path.
15 MHz Reception
These results are similar to the 10 MHz results, but with smaller maximums and minimums.
The lower signal strengths are likely due to using the 7 MHz Hamstick on 15 MHz, as 15 MHz is
around twice the resonant frequency of the Hamstick – which would result in a poor match.
In Conclusion
It would be nice to apply ray tracing to our monitoring results. I know ray tracing has been done
for this eclipse with ray tracing software other than Proplab Pro V3, so there’s still hope. That
might enable us to understand what was going on with the five frequencies we monitored.
Appendix – Idaho National Labs ionosonde data
Prior to the eclipse, Bill NQ6Z and others interfaced with personnel at the Idaho National
Laboratories to change the cadence (how often it took data) of the Idaho National Labs
ionosonde from every 15 minutes to every minute. This ionosonde was on the totality track.
The following plot shows what happened to the ionosphere at this location. This plot is from
Reinisch, Dandenault, Galkin, Hamel and Richards; Investigation of the Electron Density
Variation During the 21 August 2017 Solar Eclipse; Geophysical Research Letters, 45, 1253-
1261, https://doi.org/10.1002/2017GL076572. The dashed lines are the predicted values from the
International Reference Ionosphere without the eclipse.
Just like the temperature plot on the first page, the F2 region response lagged the eclipse a bit.
But the F1 and E region, being lower in the atmosphere with faster recombination times, tracked
the eclipse very well (maximum obscuration at 1732 UTC).
Appendix – Totality Track
Here’s the totality track across the USA for the August 21, 2017 solar eclipse.

