NASA Technical Reports Server (NTRS) 20160005914: Nature, Origin, Potential Composition, and Climate Impact of the Asian Tropopause Aerosol Layer (ATAL) PDF
Preview NASA Technical Reports Server (NTRS) 20160005914: Nature, Origin, Potential Composition, and Climate Impact of the Asian Tropopause Aerosol Layer (ATAL)
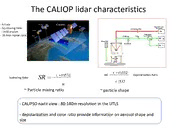
Nature, origin, potential composition, and climate impact of the Asian Tropopause Aerosol Layer (ATAL) T. D. Fairlie1, J.-P. Vernier1,2, L.W. Thomason1, M. Natarajan1 1. NASA Langley Research Center, Hampton, Virginia, USA 2. Science Systems and Applications, Inc., Hampton, Virginia, USA contributions from K. Bedka1, F. Wienhold4, J. Bian5 and B.Martinsson6 , 4. Swiss Federal Institute of Technology, Zurich, Switzerland. 5. LAGEO, Institute of Atmospheric Physics, Chinese Acad. Sci., Beijing, China. 6. Lund University, Sweden. Transport of pollution in the Upper Troposphere by Asian Monsoon MLS/CO July-Aug 05 100hPa ECHAM Model CO Park et al. (2006) (Lawrence et al., 2010, ACPD) - Enhanced levels of CO observed in the Upper Troposphere (UT) within the Asian Anticyclone - CO is lifted up from Southeast Asia to the UT by convection in monsoon - Other tracers of pollution (e.g. HCN) also peak here during the monsoon (Randel et al. 2010) - Questions: (1) Do we see a similar maximum in the UT for aerosols during the Asia Monsoon? (2) Is deep convection in the monsoon an effective means to transport aerosols to the stratosphere? The CALIOP lidar characteristics -A-train -Eqcrossing time : 1h30 am/pm -16 days repeat cycle b b ¶ = (^ +//)532 = (^ +//)532 Depolarization Ratio SR b Scattering Ratio b ^ ( )532 m ~ Particle mixing ratio ~ particle shape - CALIPSO nadir view : 80-180 m resolution in the UTLS - depolarization and color ratio provide information on aerosol shape and size Cloud clearing (Vernier et al., 2009) Ice Clouds ¶ Aerosols Background Enhancement SR 532 nm -CALIOP depolarization used to distinguish Ice Clouds and (low depolarizing) aerosol particles -Note: All points shown within 15-17 km in Southeast Asia The Asian Tropopause Aerosol Layer Time series of Cloud- filtered Scattering Ratio (SR) from CALIOP Jun-Aug mean map of SR (15 - 17km) and longitude cross-section (15-45oN), below. ATAL shown by enhanced SR during Asian Monsoon; ATAL extends from top of convective outflow. Periods affected by volcanic aerosol Removed from map and section Vernier et al., (JGR, in review) Evidence of ATAL from SAGE II and from balloon-sonde SAGE II JJA 1999-2005 COBALD, Lhasa 20km 15km SR@532 nm - Maximum aerosol seen by SAGE II, 1999-2005 - First confirmation by in situ (COBALD) SR in 2010 from SAGE II 1020 nm aerosol ext. ratio, 16 Lhasa,Tibet (G. Wienhold (LUS), J. Bian, (CAS)) vs. mean km, and 15-45oN; from Thomason and Vernier. (2013) CALIOP SR profile. ATAL composition CARIBIC observations C to S mass ratio - Large fraction of carbonaceous aerosol observed in CARIBIC aircraft impacter data (B. Martinsson) in the Asian anticyclone Vernier et al., 2014 (JGR, in review) GEOS-Chem 360K maps for August 2008 SO SO 4 2 ORGANIC ppt BC ppt ppt ppt Find minimum SO4 (10-20 ppt), (and SO2 (<10 ppt)) in ATAL; peaks in organic (120-240 ppt) and BC (80-140 ppt). GEOS-Chem cross-sections at 30oN, August, 2008 SO SO 4 2 ORG phobic BC phobic ORG philic BC philic Convective transport shown by hydrophobic components; SO4 (and SO2) very efficiently Scavenged by precipitation Left: Trajectory mapping from CALIPSO orbital data to regions of deep convection (BT<220K from Kalpana); Bottom: Map of mean CALIPSO SR (AOI) for parcels sourced to deep convection, 1-16 Aug., 2008. Vernier et al., 2014 (JGR, in review)
