Missouri's Top Openings 2010-2012 PDF
Preview Missouri's Top Openings 2010-2012
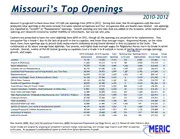
MMiissssoouurrii’’ss TToopp OOppeenniinnggss 2010-2012 Missouri is projected to have more than 157,600 job openings from 2010 to 2012. During this time, the 20 occupations with the most p rojected total openings in the state include five sales-related occupations and four occupations that are health care-related. Job openings a re classified as “Growth” or “Replacement” openings. Growth openings are new jobs that are added to the economy, while replacement openings are vacancies created by worker mobility or retirements, but are not new jobs. C ashiers are projected to have the most openings from 2010 to 2012, though all the openings are projected to be replacements. This occupation has a Grade C due to the lack of growth in the occupation, and lower than average wages. Registered Nurses, on the other hand, have more openings due to growth than replacements indicating strong future demand in that occupation in the state. The c ombination of its above average total openings, fast growth, and higher than average wages for Registered Nurses merit its Grade A career outlook. Overall, twelve of the 20 fastest growing occupations have a Grade A or B outlook in terms of having above average openings, Total Openings growth, and wages. 2010 Estimated 2012 Projected Total Openings Due Openings Due to Average Career Occupation Employment Employment Openings to Growth Replacement Annual Wage Grade Cashiers 74,170 74,690 9,321 520 8,801 $19,081 C Waiters & Waitresses 51,040 51,210 6,132 168 5,964 $19,318 C Retail Salespersons 78,320 79,530 5,845 1,205 4,640 $24,838 B- Customer Service Representatives 46,270 47,680 4,261 1,407 2,854 $30,672 B Combined Food Preparation and Serving Workers, Incl. Fast Food 78,090 79,470 4,090 1,387 2,703 $17,589 C Registered Nurses 65,670 67,320 2,819 1,654 1,165 $59,142 A Laborers and Freight, Stock, & Material Movers, Hand 36,100 35,960 2,435 0 2,435 $25,492 D Office Clerks, General 69,140 69,700 2,347 552 1,795 $28,575 B- General and Operations Managers 40,870 40,480 2,239 0 2,239 $92,266 B Truck Drivers, Heavy & Tractor-Trailer 41,210 42,070 2,209 868 1,341 $38,452 A- Counter Attendants, Cafeteria, Food Concession, & Coffee Shop 8,960 9,030 2,204 70 2,134 $18,455 C Stock Clerks and Order Fillers 33,480 33,890 2,016 407 1,609 $22,912 B- Sales Representatives, Wholesale & Manufacturing, Excl. Tech.& Sci. Products 30,980 31,520 1,890 533 1,357 $58,073 A- Child Care Workers 27,320 27,440 1,811 117 1,694 $19,933 C Team Assemblers 27,010 27,600 1,788 595 1,193 $28,580 B Personal & Home Care Aides 20,680 21,980 1,743 1,302 441 $18,743 C+ Janitors & Cleaners, Excl. Maids & Housekeeping Cleaners 46,570 46,220 1,654 0 1,654 $22,587 D Licensed Practical & Licensed Vocational Nurses 18,340 18,760 1,551 417 1,134 $35,868 A- Accountants & Auditors 29,060 29,650 1,470 597 873 $59,985 A+ Medical Secretaries 21,750 22,590 1,426 834 592 $29,574 B Da ta Sources: MERIC Short-term Occupational Projections, MERIC Occupational Employment and Wage Survey, and U.S. Bureau of Labor Statistics (BLS). ERIC Career Grades are assigned by analyzing an occupation’s percent change, total openings, and average wage relative to all other occupations in the state. An occupation’s combination of scores on these three factors determines its grade. Tl M ELY TARGETED INTE11.IGENT
