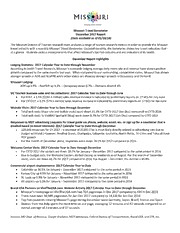
Missouri Travel Barometer December 2017 Report PDF
Preview Missouri Travel Barometer December 2017 Report
Missouri Travel Barometer December 2017 Report (Data available as of 01/18/18) The Missouri Division of Tourism research team analyzes a range of tourism research metrics in order to provide the Missouri travel industry with a monthly Missouri Travel Barometer. Updated monthly, the barometer shows key travel indicators that - at a glance - illustrate various measurements that affect Missouri’s tourism industry and are indicators of its health. December Report Highlights Lodging Statistics: 2017 Calendar Year to Date through November According to Smith Travel Research, Missouri’s statewide lodging average daily room rate and revenue have shown positive growth compared to the same months last year. When compared to our surrounding, competitive states, Missouri has shown stronger growth in ADR and RevPAR while other states are showing stronger growth in Occupancy and Demand. Missouri Lodging: ADR up 3.9% -- RevPAR up 3.2% -- Occupancy down 0.7% -- Demand down 0.1% SIC Tourism business sales and tax collections: 2017 Calendar Year to Date through June For FY17, a 1.5% ($194.4 million) sales revenue increase is indicated by preliminary reports on 17 SICs for July-June For CYTD17, a 1.2% ($79.5 million) sales revenue increase is indicated by preliminary reports on 17 SICs for Jan-June Website Visits: 2017 Calendar Year to Date through December Total web visits (main site and mobile visits) were down 25.3% for CYTD 2017 (Jan-Dec) compared to CYTD 2016 Total web visits to VisitMO Spotlight (blog) were down 8.7% for CYTD 2017 (Jan-Dec) compared to CYTD 2016 Responses to MDT advertising (requests for travel guide via phone, website, email, etc. or sign up for a newsletter that is emailed based on travel interests): 2017 Calendar Year to Date through December 119,845 responses for CY 2017 – a decrease of 23.8% (This is most likely directly related to advertising cuts due to budget withhold.) However, Bowling Green, Champaign, Lafayette, Louisville, North Platte, Tri Cities and Tulsa all have YOY growth For the month of December alone, responses were down 78.1% for 2017 compared to 2016 Welcome Center Visits: 2017 Calendar Year to Date through December For CYTD 2017 the centers are down 20.7% for January – December 2017 compared to the same period in 2016 Due to budget cuts, the Welcome Centers started closing on weekends as of August. For the month of December alone, visits are down 41.7% for 2017 compared to 2016. For August – December, the decline is 45.8%. Commercial airport deplanements: 2017 Calendar Year to Date Columbia up 36.5% for January – December 2017 compared to the same period in 2016 Kansas City up 4.5% for January – November 2017 compared to the same period in 2016 St. Louis up 5.8% for January – November 2017 compared to the same period in 2016 All airports up 5.3% for January – September 2017 compared to the same period in 2016 Brand USA Partners on VisitTheUSA.com: Website Activity 2017 Calendar Year to Date through December Missouri’s homepage on VisitTheUSA.com had 724 pageviews in Dec 2017 compared to 434 in Dec 2016 There have been 10,989 pageviews for Jan-Dec 2017 compared to 14,536 for Jan-Dec 2016 Top five countries viewing Missouri’s page during December were Germany, Japan, Brazil, France and Spain Visitors from the Italy spent the most time on our page, averaging 12 minutes and 42 seconds compared to an overall average of 3 minutes and 37 seconds Sources: MO Dept. of Revenue, Google Analytics, MDT databases, Federal Bureau of Transportation, Brand USA, and STR, Inc. Sales Revenue from 17 Tourism SICs 1,300 s $1.225B$1.228B n o 1,200 Milli 1,100 $1.201B 1,000 900 800 700 600 500 Jan Feb Mar Apr May Jun Jul Aug Sep Oct Nov Dec CY 2015 CY 2016 CY 2017 CYTD 2015, $6.2B CYTD 2016, $6.5B CYTD 2017,$6.6 B YOY: +1.2% Visits to VisitMO (Full & Mobile Sites) by YTD Visits to VisitMO by Site Month 3,000 400 s s d d n an sa 2,500 401 us 300 ou o h Th T 2,000 367 Blog 200 1,276 1,500 96 Full Site 958 100 93 1,000 Mobile 69 - Site 500 1,062 801 Jan FebMarAprMayJun Jul Aug Sep Oct Nov Dec - 2015 2016 2017 2016 YTD 2017 YTD 2 KC & STL Airport Deplanements All Other Airport Deplanements 700 500,000 s 626 d 3,577 an 600 450,000 3,465 26,064 s 5,571 u 592 21,870 o 400,000 5,445 60,368 Th 500 476 47,031 4,082 463 350,000 3,455 Kirksville 400 300,000 Joplin 300 250,000 Ft L 200 200,000 Columbia 352,020 365,341 100 150,000 Cape G - 100,000 Springfield Jan FebMarAprMayJun Jul Aug Sep Oct NovDec 50,000 KC - 2016 KC - 2017 STL - 2016 STL - 2017 0 Jan - Sep 2016 Jan - Sep 2017 Welcome Center Visitors Responses to MDT Advertising 90 160,000 s 14,278 d an 80 140,000 9,126 s u 70 o Th 60 120,000 34,004 12,962 Base Markets 7,198 50 100,000 Priority Market 40 Started closing on 80,000 26,107 29,322 Spill (Out-of-State) 33.0 30 weekends 8,462 30.8 Spill (In-State) 60,000 21,250 20 19.3 Opportunity 7,037 10 40,000 65,314 All Other 0 20,000 42,076 Jan Feb Mar Apr May Jun Jul Aug Sep Oct Nov Dec 0 2015 2016 2017 2016 CYTD 2017 CYTD 3
