Missouri Annual Performance Report Summary Part C 2021 PDF
Preview Missouri Annual Performance Report Summary Part C 2021
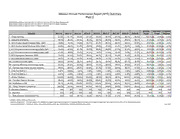
Missouri Annual Performance Report (APR) Summary Part C Determination based on data from 2011-12, 2014-15, 2015-16, 2017-18: Meets Requirements Determination based on data from 2013-14, 2016-17, 2018-19, 2019-20: Needs Assistance Determination based on data from 2012-13: Needs Intervention 2019-20 Gap from Progress/ Indicator 2011-12 2012-13 2013-14 2014-15 2015-16 2016-17 2017-18 2018-19 2019-20 Target Target Slippage 1 - Timely Services 81.6% 87.1% 95.5% 97.3% 97.6% 96.0% 97.3% 96.4% 96.0% = 100.0%0 -4.0% + -0.4% 2 - Natural Environments 98.9% 99.0% 99.3% 99.4% 99.5% 99.4% 99.4% 99.5% 99.7% ≥ 97.0%~ 2.7%I+ 0.2% 3 - ECO Positive Social Emotional Skills: SS#1* 74.6% 79.1% 79.9% 82.7% 87.2% 88.4% 90.3% 90.4% 90.8% ≥ 69.2%I~ 21.6%I+ 0.4% 3 - ECO Positive Social Emotional Skills: SS#2 43.5% 38.4% 31.8% 26.8% 26.0% 22.6% 21.3% 18.3% 13.6% ≥ 47.5%0 -33.9% + -4.7% 3 - ECO Acquisition & Use of Knowledge & Skills: SS#1 76.9% 80.4% 81.7% 84.6% 88.6% 90.0% 91.5% 91.5% 90.9% ≥ 70.4%0 20.5% -0.6% 1 .... 3 - ECO Acquisition & Use of Knowledge & Skills: SS#2 41.3% 38.5% 33.7% 21.4% 19.2% 17.0% 16.4% 13.9% 11.2% ≥ 45.6%~ -34.4%I"' -2.7% 3 - ECO Appropriate Behaviors: SS#1 78.2% 81.8% 82.5% 84.4% 88.7% 90.1% 91.2% 91.2% 91.5% ≥ 73.1%0 18.4% + 0.3% 3 - ECO Appropriate Behaviors: SS#2 33.2% 31.1% 25.8% 26.8% 26.3% 22.7% 20.2% 17.2% 12.3% ≥ 36.2%I~ -23.9%I-&- -4.9% 4A - Families know their rights 96.2% 96.9% 96.2% 98.6% 98.7% 98.5% 99.3% 99.1% 98.9% ≥ 95.0%I~ 3.9%I"' -0.2% 4B - Families effectively communicate needs 97.2% 97.8% 97.9% 96.2% 97.2% 96.8% 98.6% 97.0% 97.5% ≥ 95.7%0 1.8% + 0.5% 4C - Families help children develop and learn 98.0% 98.6% 98.2% 97.6% 97.3% 97.6% 98.8% 98.3% 97.2% ≥ 96.4%0 0.8% + -1.1% 5 - Child Find Birth to 1 0.97% 0.98% 1.01% 1.14% 1.26% 1.33% 1.33% 1.35% 1.38% ≥ 0.80%0 0.6%I+ 0.0% 6 - Child Find Birth to 3 2.21% 2.23% 2.22% 2.41% 2.64% 2.87% 2.95% 3.16% 3.29% ≥ 2.00%0 1.3% + 0.1% 7 - 45-day Timelines 100.0% 94.0% 100.0% 100.0% 98.2% 98.2% 98.3% 100.0% 100.0% = 100.0%0 0.0%+ 0.0% 8A - Transition Steps & Services 98.4% 48.0% 89.5% 89.9% 100.0% 92.6% 93.8% 90.0% 90.0% = 100.0%0 -10.0%+ 0.0% 8B - Notification to LEA 95.1% 84.8% 100.0% 100.0% 100.0% 100.0% 100.0% 98.5% 98.9% = 100.0%0 -1.1% + 0.4% 8C - Timely Transition Conference 100.0% 92.9% 100.0% 100.0% 100.0% 98.8% 98.8% 100.0% 96.6% = 100.0%0 -3.4% + -3.4% 9 - Resolution Sessions N/A N/A N/A N/A N/A N/A N/A N/A N/A N/A N/A N/A 10 - Mediation N/A N/A N/A N/A N/A N/A N/A N/A N/A N/A N/A N/A 11 - State Systemic Improvement Plan N/A N/A 69.1% 92.0% 89.5% 91.3% 91.4% 90.8% 89.2% ≥ 79.1%0 10.1% + -1.6% * Indicator 3 (Early Childhood Outcomes): Summary Statement 1 - Of those children who entered the program below age expectations in Outcome, the percent that substantially increased their rate of growth in the Outcome by the time they exited Summary Statement 2 - Percent of children who were functioning within age expectations in Outcome by the time they exited. June 2021
