Math Classified According to the Syllabus IGCSE (0580) PDF
Preview Math Classified According to the Syllabus IGCSE (0580)
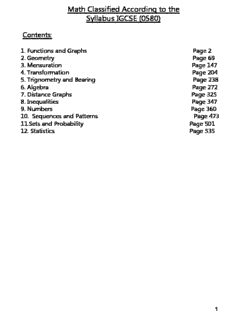
Math Classified According to the Syllabus IGCSE (0580) Contents: 1. Functions and Graphs Page 2 2. Geometry Page 69 3. Mensuration Page 147 4. Transformation Page 204 5. Trignometry and Bearing Page 238 6. Algebra Page 272 7. Distance Graphs Page 325 8. Inequalities Page 347 9. Numbers Page 360 10. Sequences and Patterns Page 473 11.Sets and Probability Page 501 12. Statistics Page 535 1 EXTENDED MATHEMATICS 2002 – 2011 CLASSIFIEDS FUNCTIONS&GRAPHS Compiled & Edited By Muhammad Maaz Rashid 2 11 1 17 f(x) = (x ≠ O4) x+4 2 g(x) = x – 3x 3 h(x) = x + 1 (a) Work out fg(1). Answer(a) [2] (b) Find hO1(x). Answer(b) hO1(x) = [2] (c) Solve the equation g(x) = O2. Answer(c) x = or x = [3] © UCLES 2011 0580/21/O/N/11 3 8 x3 5 (a) Complete the table for the function f(x) = −3x−1. 2 x –3 –2 –1.5 –1 0 1 1.5 2 3 3.5 f(x) –5.5 1.8 1.5 –3.5 –3.8 –3 9.9 [3] (b) On the grid draw the graph of y = f(x) for O3 Y x Y 3.5 . y 10 8 6 4 2 x –3 –2 –1 0 1 2 3 4 –2 –4 –6 [4] © UCLES 2011 0580/41/O/N/11 4 9 (c) Use your graph to (i) solve f(x) = 0.5, Answer(c)(i) x = or x = or x = [3] (ii) find the inequalities for k, so that f(x) = k has only 1 answer. Answer(c)(ii) k I k K [2] (d) (i) On the same grid, draw the graph of y = 3x – 2 for O1 Y x Y 3.5 . [3] x3 (ii) The equation −3x−1 = 3x – 2 can be written in the form x3 + ax + b = 0. 2 Find the values of a and b. Answer(d)(ii) a = and b = [2] x3 (iii) Use your graph to find the positive answers to −3x−1 = 3x – 2 for O3 Y x Y 3.5 . 2 Answer(d)(iii) x = or x = [2] © UCLES 2011 0580/41/O/N/11 5 4 2 f(x) = 4x O 2 2 g(x) = +1 x h(x) = x2 + 3 (a) (i) Find the value of hf(2). Answer(a)(i) [2] (ii) Write fg(x) in its simplest form. Answer(a)(ii) fg(x) = [2] (b) Solve g(x) = 0.2. Answer(b) x = [2] (c) Find the value of gg(3). Answer(c) [2] © UCLES 2011 0580/42/O/N/11 6 5 (d) (i) Show that f(x) = g(x) can be written as 4x2 – 3x – 2 = 0. Answer (d)(i) [1] (ii) Solve the equation 4x2 – 3x – 2 = 0. Show all your working and give your answers correct to 2 decimal places. Answer(d)(ii) x = or x = [4] © UCLES 2011 0580/42/O/N/11 7 14 1 7 The diagram shows the accurate graph of y = f(x) where f(x) = +x2 for 0 I x Y 3. x y 10 8 6 4 2 x –3 –2 –1 0 1 2 3 –2 –4 –6 –8 –10 © UCLES 2011 0580/42/O/N/11 8 15 1 (a) Complete the table for f(x) = x + x2 . x O3 O2 O1 O0.5 O0.3 O0.1 f(x) 3.5 0 O1.8 [3] (b) On the grid, draw the graph of y = f(x) for O3 Y x I 0. [3] (c) By drawing a tangent, work out an estimate of the gradient of the graph where x = 2. Answer(c) [3] (d) Write down the inequality satisfied by k when f(x) = k has three answers. Answer(d) [1] (e) (i) Draw the line y = 1 – x on the grid for O3 Y x Y 3. [2] 1 (ii) Use your graphs to solve the equation 1 – x = + x2 . x Answer(e)(ii) x = [1] 1 (f) (i) Rearrange x3 O x2 – 2x + 1 = 0 into the form + x2 = ax + b, where a and b are integers. x Answer(f)(i) [2] (ii) Write down the equation of the line that could be drawn on the graph to solve x3 O x2 – 2x + 1 = 0 . Answer(f)(ii) y = [1] © UCLES 2011 0580/42/O/N/11 9 4 2 (a) Complete the table of values for y = 2x. x –2 –1 0 1 2 3 y 0.25 1 2 8 [2] (b) On the grid, draw the graph of y = 2x for O2 Y x Y 3. y 10 9 8 7 6 5 4 3 2 1 x –2 –1 0 1 2 3 –1 [3] © UCLES 2011 0580/43/O/N/11 10
Description: