Keystone Acquisition Corp March 2018 Credit Opinion PDF
Preview Keystone Acquisition Corp March 2018 Credit Opinion
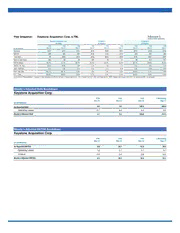
Revenue ($Millions - Left Axis) Debt/EBITDA (Right Axis) What Could Change the Rating Up (Leverage) $190.0 6.5x $170.0 $170.0 $161.4 $156.7 6.0x $150.0 6.0x $130.0 5.7x 5.5x 5.5x $110.0 5.0x $90.0 4.5x $70.0 $50.0 4.0x PF 2016 LTM 9/30/17 FY 2018 (P) Assessment and Eligibility 14% Quality Management 43% Case Management 43% KEPRO's Revenue ($Millions) Median Revenue of Moody's B3 Rated Corporates Median Revenue of Moody's Single-B Rated Corporates $1,000.0 $872.0 $900.0 $800.0 $700.0 $592.0 $600.0 $500.0 $400.0 $300.0 $200.0 $156.7 $161.4 $170.0 $100.0 $- 2016 LTM 9/30/17 FY 2018 (P) Rest of Customers 42% Top 4 Customers 58% Rating Factors Keystone Acquisition Corp. Business and Consumer Service Industry Grid [1][2] LTM 9/30/2017 Moody's 12-18 Month Forward View Factor 1 : Scale (20%) Measure Score Measure Score a) Revenue (USD Billion) $0.2 Ca $0.2 Ca Factor 2 : Business Profile (20%) a) Demand Characteristics B B B B b) Competitive Profile B B B B Factor 3 : Profitability (10%) a) EBITA Margin 32.1% A 31% A Factor 4 : Leverage and Coverage (40%) a) Debt / EBITDA 5.7x B 5.5x B b) EBITA / Interest 1.8x B 1.8x B c) RCF / Net Debt 0.2% Ca 6.3% Caa Factor 5 : Financial Policy (10%) a) Financial Policy B B B B Rating: a) Indicated Rating from Grid B3 B2 b) Actual Rating Assigned B3 Moody's-Adjusted Debt Breakdown Keystone Acquisition Corp. FYE FYE FYE LTM Ending Dec-14 Dec-15 Dec-16 Sep-17 (in US Millions) As Reported Debt 0.0 0.0 240.4 305.0 Operating Leases 4.7 9.4 9.4 9.4 Moody's-Adjusted Debt 4.7 9.4 249.8 314.4 Moody's-Adjusted EBITDA Breakdown Keystone Acquisition Corp. FYE FYE FYE LTM Ending Dec-14 Dec-15 Dec-16 Sep-17 (in US Millions) As Reported EBITDA 6.9 33.1 51.9 38.0 Operating Leases 1.2 3.1 3.1 3.1 Unusual 0.0 0.0 -2.6 14.0 Moody's-Adjusted EBITDA 8.2 36.2 52.4 55.1
