
HPE IMC APM SQL Server Application Monitor Configuration Examples PDF
Preview HPE IMC APM SQL Server Application Monitor Configuration Examples
HPE IMC APM SQL Server Application Monitor Configuration Examples Part number: 5200-1353 Software version: IMC APM 7.2 (E0401) Document version: 1 The information in this document is subject to change without notice.© Copyright 2016 Hewlett Packard Enterprise Development LP Contents Introduction ·····················································································1 Prerequisites ···················································································1 Example: Using APM to monitor SQL Server ··········································1 Network requirements ················································································································· 1 Adding a SQL Server application monitor ························································································ 1 Configuring global thresholds for the SQL Server application monitor ···················································· 3 Verifying the configuration ············································································································ 4 Viewing the SQL Server application monitor report ····································································· 4 Viewing a threshold alarm ····································································································· 9 i Introduction This document provides examples for configuring APM to monitor SQL Server database servers in a data center. APM can monitor SQL Server 2000 SP4, SQL Server 2005, SQL Server 2008, and SQL Server 2012. This document uses SQL Server 2012 as an example. Prerequisites Before you configure APM to monitor SQL Server 2012, complete the following configurations: • Configure and start SQL Server. • To obtain traffic data for application monitor reports, install an IMC probe and add the probe to APM. • To use the SQL Server authentication type, obtain the SQL Server user name and password and make sure the user has administrator privileges. • To use the Windows authentication type, obtain the Windows user name and password and make sure the user has SQL Server administrator privileges. Example: Using APM to monitor SQL Server Network requirements As shown in Figure 1, a company's data center uses a SQL Server database server to provide database services. The database server administrator intends to monitor SQL Server in APM. Figure 1 Network diagram Table 1 Host addresses and software versions Host IP address Software version • Windows Server 2008 R2 IMC 172.4.95.21 • IMC PLAT 7.2 (E0403) • IMC APM 7.2 (E0401) • Windows Server 2012 Database server 172.4.8.88 • SQL Server 2012 Adding a SQL Server application monitor 1. Log in to IMC. 2. Click the Resource tab. 1 3. From the navigation tree, select Application Manager > Add Application. 4. Click SQL Server of the Database Server Monitor category. 5. Configure the following monitoring parameters for the SQL Server application monitor on the host, as shown in Figure 2: Enter 172.4.8.88 in the IP Address field. The Name field is automatically populated with MSSQL_172.4.8.88. Select SQL Server authentication from the Authentication Type list. Enter the user name and password in the Username and Password fields, respectively. Use the default settings of other parameters. Figure 2 Adding an application monitor for SQL Server 6. Click OK. The application monitor named MSSQL_172.4.8.88 appears on the application monitor list, as shown in Figure 3. Figure 3 Viewing the application monitor list 2 Configuring global thresholds for the SQL Server application monitor 1. Click the Resource tab. 2. From the navigation tree, select Application Manager > Configurations. 3. Click Threshold Configuration. The threshold configuration page appears. 4. Click the Global Threshold tab. 5. Click Database Server Monitor next to Application Category. 6. Click SQL Server next to Application Type. The list displays all SQL Server indexes for which you can configure thresholds, as shown in Figure 4. Figure 4 Global threshold list This example describes threshold settings of the Average Wait Time parameter. 7. Click the Modify icon for the Average Wait Time parameter. The Modify Threshold page appears. 8. Configure the following parameters, as shown in Figure 5: Select Enable from the Enable Level-1 Threshold list. Set a level-1 threshold value in the Threshold field. Set an alarm trigger frequency in the Trigger Times field. Select Enable from the Enable Level-2 Threshold list. Set a level-2 threshold value in the Threshold field. Set an alarm trigger frequency in the Trigger Times field. APM generates a level-1 or level-2 threshold alarm when the Average Wait Time meets the number of times specified by Trigger Times for the level-1 or level-2 threshold. 3 Figure 5 Modifying thresholds 9. Click OK. Verifying the configuration Viewing the SQL Server application monitor report 1. Click the Resource tab. 2. From the navigation tree, select Application Management > Application Monitor. The application monitor list displays all application monitors. 3. Click MSSQL_172.4.8.88 to display the report. Figure 6 shows part of the SQL Server application monitor report. The report contains index values obtained from the most recent polling of the application. 4 Figure 6 SQL Server application monitor report The following information describes some fields in the report. Memory Usage The Memory Usage area contains the following fields, as shown in Figure 7: • Total Memory—Total size of the dynamic memory used by the SQL Server application. • SQL Buffer—Size of the dynamic memory used by the SQL Server application for SQL cache. Click the History Record icon to view the history graph of the SQL buffer. • Optimizer Memory—Size of the dynamic memory used by the SQL Server application to query optimization. Click the History Record icon to view the history graph of the optimizer memory. • Lock Memory—Size of the dynamic memory used by the SQL Server application for locks. Click the History Record icon to view the history graph of the lock memory. • Connection Memory—Size of the dynamic memory used by the SQL Server application to maintain connections. Click the History Record icon to view the history graph of the connection memory. • Granted Workspace Memory—Size of the dynamic memory that the SQL Server application allocated for processes to perform operations, such as hashing, sorting, copying, and creating indexes. • Undetermined Memory—Number of processes that were waiting for the permissions to use the workspace memory. • Memory Grants Outstanding—Number of processes that were permitted to use the workspace memory. 5 Figure 7 Memory Usage area Connection Statistics The Connection Statistics area contains the following fields, as shown in Figure 8: • Connection Time—Time consumed when APM established the connection with the SQL Server application. Click the Set Threshold icon to set alarm thresholds for the connection time. Click the History Record icon to view the history graph of the connection time. • Active Connections—Number of connections between the SQL Server application and its users. Click the History Record icon to view the history graph of active connections. • Logins/sec—Number of newly established connections per second. Click the History Record icon to view the history graph of logins per second. • Logouts/sec—Number of terminated connections per second. Click the History Record icon to view the history graph of logouts per second. Figure 8 Connection Statistics area 6 Lock Details The Lock Details area contains the following fields, as shown in Figure 9: • Lock Requests/sec—Number of lock requests and the lock conversions received by the SQL Server application per second. Click the Set Threshold icon to set alarm thresholds for the lock requests per second. Click the History Record icon to view the history graph of the lock requests per second. • Lock Waits/sec—Number of waiting lock requests per second. Click the Set Threshold icon to set alarm thresholds for the lock waits per second. Click the History Record icon to view the history graph of the lock waits per second. • Lock Timeouts/sec—Number of lock requests that timed out per second. Click the Set Threshold icon to set alarm thresholds for the lock timeouts per second. Click the History Record icon to view the history graph of the lock timeouts per second. • Number of Deadlocks/sec—Number of lock requests that resulted in deadlocks per second. Click the Set Threshold icon to set alarm thresholds for the number of deadlocks per second. Click the History Record icon to view the history graph of the number of deadlocks per second. • Average Wait Time—Average waiting time for each lock request. Click the Set Threshold icon to set alarm thresholds for the average wait time. Click the History Record icon to view the history graph of the average wait time. Figure 9 Lock Details area Latch Details The Latch Details area contains the following fields, as shown in Figure 10: • Latch Waits/Min—Number of waiting latch requests per second. Click the History Record icon to view the history graph of the latch waits per minute. 7 • Average Latch Wait Time—Average waiting time (in millisecond) for latch requests. Click the History Record icon to view the history graph of the average latch wait time. Figure 10 Latch Details area Database Details The Database Details area contains the following fields, as shown in Figure 11: • Database—Name of the running database in the SQL server application. "_Total" indicates statistics for all databases. • Size—Disk space for the database. • Transactions—Number of transactions that the database started per minute. • Active Transactions—Number of active transactions of the database. • Log File—Disk space for the database log files. • Log Files Used—Size of used log files in the database. • Log Files Usage Ratio—Usage ratio of the log files in the database. Log Files Usage Ratio = Log Files Used/Log Files x 100%. Click the Set Threshold icon to set alarm thresholds for the log file usage. • Log Writes—Times of writing the log to the log file per minute. • Log Write Waits—Number of logs that were waiting to be written to the log files. • Log Write Wait Time—Calculated waiting time before the log was written to the log file. Figure 11 Database Details area Top 10 SQL By Execution Durations The Top 10 SQL By Execution Durations contains the following fields, as shown in Figure 12: • SQL—SQL statement whose execution duration reaches top 10 among all SQL statements. 8
Description:The list of books you might like

Mind Management, Not Time Management

Shatter Me Complete Collection (Shatter Me; Destroy Me; Unravel Me; Fracture Me; Ignite Me)

Atomic Habits James Clear

Haunting Adeline

84 recetas de la cocina francesa
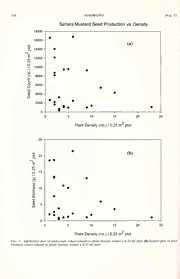
SEED PRODUCTION BY THE NON-NATIVE BRASSICA TOURNEFORTII (SAHARA MUSTARD) ALONG DESERT ROADSIDES

Investigating Psychology 2 - From Social to Cognitive
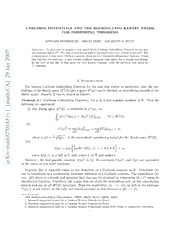
Carleson Potentials and the Reproducing Kernel Thesis for Embedding Theorems
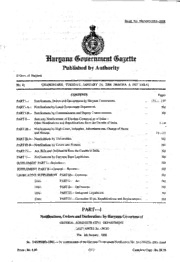
Haryana Gazette, 2006-01-04, No. 4
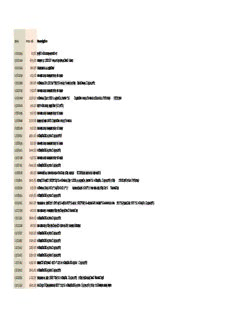
Arrow Prislista 2018.xlsx

Mary Baldwin College Magazine
C. OEC 9

Chocolat / Шоколад
Neotropical Bats from Western Mexico by Sydney Anderson
NASA Technical Reports Server (NTRS) 20100014086: Automated Solvent Seaming of Large Polyimide Membranes
Greek Government Gazette: Part 4, 2006 no. 450

NASA Technical Reports Server (NTRS) 20060028193: Practical Aspects of the Equation-Error Method for Aircraft Parameter Estimation
NASA Technical Reports Server (NTRS) 20060051730: Flame Structure and Scalar Properties in Microgravity Laminar Fires
ANSI NEMA CC-1-2009 Electric Power For Substations
A Summary of Lightpipe Radiation Thermometry Research at NIST
NASA Technical Reports Server (NTRS) 20080015510: Utilizing Calibrated GPS Reflected Signals to Estimate Soil Reflectivity and Dielectric Constant: Results from SMEX02
NASA Technical Reports Server (NTRS) 20080014294: Arbitrary Steady-State Solutions with the K-epsilon Model


