Hazard Assessment for the Eemskanaal area of the Groningen field (deel 5) PDF
Preview Hazard Assessment for the Eemskanaal area of the Groningen field (deel 5)
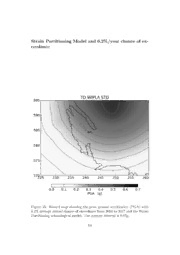
Figure 54: Hazard map showing the peak ground acceleration (PGA) with 10% average annual chance of exceedance from 2014 to 2017 and the Activity Rate seismological model. The contour interval is 0.01g. 62 Strain Partitioning Model and 0.2%/year chance of ex- ceedance Figure 55: Hazard map showing the peak ground acceleration (PGA) with 0.2% average annual chance of exceedance from 2014 to 2017 and the Strain Partitioning seismological model. The contour interval is 0.05g. 63 Figure 56: Hazard map showing the peak ground acceleration (PGA) with 0.2% average annual chance of exceedance from 2014 to 2017 and the Strain Partitioning seismological model. The contour interval is 0.05g. 64 Figure 57: Hazard map showing the peak ground acceleration (PGA) with 0.2% average annual chance of exceedance from 2014 to 2017 and the Strain Partitioning seismological model. The contour interval is 0.05g. 65 Figure 58: Hazard map showing the peak ground acceleration (PGA) with 0.2% average annual chance of exceedance from 2014 to 2017 and the Strain Partitioning seismological model. The contour interval is 0.05g. 66 Figure 59: Hazard map showing the peak ground acceleration (PGA) with 0.2% average annual chance of exceedance from 2014 to 2017 and the Strain Partitioning seismological model. The contour interval is 0.05g. 67 Figure 60: Hazard map showing the peak ground acceleration (PGA) with 0.2% average annual chance of exceedance from 2014 to 2017 and the Strain Partitioning seismological model. The contour interval is 0.05g. 68 Figure 61: Hazard map showing the peak ground acceleration (PGA) with 0.2% average annual chance of exceedance from 2014 to 2017 and the Strain Partitioning seismological model. The contour interval is 0.05g. 69 Figure 62: Hazard map showing the peak ground acceleration (PGA) with 0.2% average annual chance of exceedance from 2014 to 2017 and the Strain Partitioning seismological model. The contour interval is 0.05g. 70 Figure 63: Hazard map showing the peak ground acceleration (PGA) with 0.2% average annual chance of exceedance from 2014 to 2017 and the Strain Partitioning seismological model. The contour interval is 0.05g. 71
