FY23 LRP - Manager's Budget PDF
Preview FY23 LRP - Manager's Budget
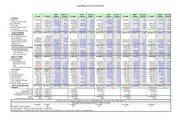
Long Range Financial Projection Dollar Percent Dollar Percent Dollar Percent Dollar Percent Dollar Percent FY 2022 FY 2023 Change Change FY 2024 Change Change FY 2025 Change Change FY 2026 Change Change FY 2027 Change Change I REVENUE A.State Aid 23,529,766 23,760,557 230,791 0.98% 23,993,656 233,099 0.98% 24,229,086 235,430 1.0% 24,466,871 237,785 1.0% 24,707,034 240,163 1.0% School Construction Aid 0 5,000,000 5,000,000 - 5,000,000 0 0.00% 0 (5,000,000) -100.0% 0 0 - 0 0 - B.Local Receipts 8,873,350 9,225,900 352,550 3.97% 9,578,450 352,550 3.82% 9,703,450 125,000 1.3% 9,803,450 100,000 1.0% 9,903,450 100,000 1.0% C. Free Cash 5,659,184 5,539,215 (119,969) -2.12% 4,701,610 (837,605) -15.12% 4,701,610 0 0.0% 4,701,610 0 0.0% 4,701,610 0 0.0% D.Overlay Reserve Surplus 400,000 400,000 0 0.00% 400,000 0 0.00% 200,000 (200,000) -50.0% 200,000 0 0.0% 200,000 0 0.0% E Property Tax 143,002,372 145,110,564 2,108,192 1.47% 148,981,373 3,870,809 2.67% 152,890,750 3,909,377 2.6% 156,871,812 3,981,062 2.6% 160,754,662 3,882,850 2.5% F Override Stabilization Fund 6,248,581 4,231,365 (2,017,216) -32.28% 7,478,241 3,246,876 76.73% 7,911,861 433,620 5.8% 0 (7,911,861) - 0 0 - TOTAL REVENUES 187,713,253 193,267,601 5,554,348 2.96% 200,133,330 6,865,729 3.55% 199,636,757 (496,573) -0.2% 196,043,743 (3,593,014) -1.8% 200,266,756 4,223,013 2.2% II APPROPRIATIONS A.One Time COVID impact 970,000 School Additions 1,030,000 1,030,000 0 0.00% General Education Costs 52,809,670 55,724,058 2,914,388 5.52% 57,312,461 1,588,403 2.85% 59,665,950 2,353,489 4.1% 62,003,590 2,337,640 3.9% 64,173,716 2,170,126 3.5% Special Education Costs 26,264,964 28,103,511 1,838,547 7.00% 30,070,757 1,967,246 7.00% 32,175,710 2,104,953 7.0% 34,428,010 2,252,300 7.0% 36,837,971 2,409,961 7.0% Growth Factor 0 (1,379,700) (1,379,700) - 335,800 1,715,500 -124.34% 240,900 (94,900) -28.3% 0 (240,900) -100.0% 21,900 21,900 - Net School Budget 80,104,634 84,447,869 4,343,235 5.42% 87,719,018 3,271,149 3.87% 92,082,560 4,363,542 5.0% 96,431,600 4,349,040 4.7% 101,033,587 4,601,987 4.8% Minuteman: Operating and Capital 5,184,582 6,208,486 1,023,904 19.75% 6,425,783 217,297 3.50% 6,650,685 224,902 3.5% 6,883,459 232,774 3.5% 7,124,380 240,921 3.5% Minuteman Exempt Capital 1,610,964 1,739,452 128,488 7.98% 1,739,452 0 0.00% 1,739,452 0 0.0% 1,739,452 0 0.0% 1,739,452 0 0.0% Town Personnel Services 30,232,896 31,393,573 1,160,677 3.84% 32,413,864 1,020,291 3.25% 33,467,315 1,053,451 3.3% 34,555,003 1,087,688 3.3% 35,678,041 1,123,038 3.3% Town Expenses 11,522,254 11,831,451 309,197 2.68% 12,215,973 384,522 3.25% 12,612,992 397,019 3.2% 13,022,914 409,922 3.2% 13,446,159 423,245 3.3% Enterprise Fund/Other 2,916,046 3,220,747 304,701 10.45% 3,325,421 104,674 3.25% 3,433,497 108,076 3.2% 3,545,086 111,589 3.3% 3,660,301 115,215 3.2% Net Town Budget 38,839,104 40,004,277 1,165,173 3.00% 41,304,416 1,300,139 3.25% 42,646,810 1,342,394 3.3% 44,032,831 1,386,021 3.2% 45,463,899 1,431,068 3.3% MWRA Debt Shift 1,845,727 0 (1,845,727) -100.00% 0 0 0.00% 0 0 0.0% 0 0 0.0% 0 0 0.0% B.Capital budget Exempt Debt Service 8,689,591 8,589,983 (99,608) -1.15% 8,488,406 (101,577) -1.18% 8,376,851 (111,555) -1.3% 8,286,454 (90,397) -1.1% 8,046,013 (240,441) -2.9% Non-Exempt Service 7,347,230 7,029,227 (318,003) -4.33% 6,863,679 (165,548) -2.36% 6,987,019 123,340 1.8% 7,963,971 976,952 14.0% 7,319,986 (643,985) -8.1% Cash 3,959,297 3,426,277 (533,020) -13.46% 3,725,432 299,155 8.73% 4,080,547 355,115 9.5% 3,516,868 (563,679) -13.8% 4,570,830 1,053,962 30.0% Offsets/Capital Carry Forward (1,692,329) (677,260) 1,015,069 -59.98% (402,736) 274,524 -40.53% (382,797) 19,939 -5.0% (339,496) 43,301 -11.3% (291,485) 48,011 -14.1% Total Capital 18,303,789 18,368,227 64,438 0.35% 18,674,781 306,554 1.67% 19,061,620 386,839 2.1% 19,427,797 366,177 1.9% 19,645,344 217,547 1.1% C.Pensions 12,635,573 13,386,750 751,177 5.94% 14,123,021 736,271 5.50% 14,899,787 776,766 5.5% 15,719,275 819,488 5.5% 16,583,835 864,560 5.5% D.Insurance 20,212,725 21,510,568 1,297,843 6.42% 22,413,644 903,076 4.20% 23,642,843 1,229,199 5.5% 24,884,092 1,241,249 5.2% 26,195,587 1,311,495 5.3% E.State Assessments 3,694,772 3,785,264 90,492 2.45% 3,878,018 92,754 2.45% 3,973,091 95,073 2.5% 4,070,541 97,450 2.5% 4,170,427 99,886 2.5% G.Overlay Reserve 745,442 600,000 (145,442) -19.51% 600,000 0 0.00% 800,000 200,000 33.3% 600,000 (200,000) -25.0% 600,000 0 0.0% H.Reserve Fund 1,720,145 1,753,178 33,033 1.92% 1,841,667 88,489 5.05% 1,833,480 (8,187) -0.4% 1,877,573 44,093 2.4% 1,922,207 44,634 2.4% I. Court Judgments/Symmes 667,450 100,000 (567,450) -85.02% 100,000 0 0.00% 100,000 0 0.0% 100,000 0 0.0% 100,000 0 0.0% J. Warrant Articles 1,054,291 1,363,530 309,239 29.33% 1,313,530 (50,000) -3.67% 1,363,530 50,000 3.8% 1,313,530 (50,000) -3.7% 1,363,530 50,000 3.8% K.Override Stabilization Fund 1,094,055 0 (1,094,055) -100.00% 0 0 - 0 0 - 0 0 - 0 0 - L TOTAL APPROPRIATIONS 187,713,253 193,267,601 5,554,348 2.96% 200,133,330 6,865,729 3.55% 208,793,858 8,660,528 4.3% 217,080,150 8,286,292 4.0% 225,942,248 8,862,098 4.1% BALANCE 0 0 0 (9,157,101) (21,036,407) (25,675,492) Free Cash 11,078,429 9,403,221 9,403,221 9,403,221 9,403,221 9,403,221 Stabilization Fund 3,331,874 3,498,511 3,668,482 3,841,851 4,018,688 4,199,062 Override Stabilization Fund 19,621,467 15,390,102 7,911,861 0 0 0 Municipal Bldg. Ins. Trust Fund 687,099 693,970 700,909 707,918 714,998 722,148 TOTAL: 34,718,869 28,985,804 21,684,473 13,952,990 14,136,907 14,324,430 % of General Fund Revenue 18.5% 15.0% 10.8% 7.0% 7.2% 7.2% The plan does not include any projected revenues or expenditures from the Community Preservation Act Projected School Enrollment Growth FY 2020 - FY 2025 FY 2022** FY 2023* FY 2024* FY 2025* FY 2026* FY 2027* Actual/Proj. Annual Growth 0 -189 46 33 0 3 ** Actual Growth - FY22 50% PPC of $14,595 = $7,297 X EG * Projected Growth - FY2023 through FY2027 Based on 50% of FY19 DESE Per Pupil Cost of $14,601 = $7,300 X Enrollment Growth
