First Steps Monthly Expenditure for Direct Services by SPOE Fiscal Year 2012 PDF
Preview First Steps Monthly Expenditure for Direct Services by SPOE Fiscal Year 2012
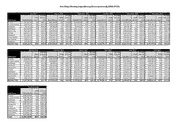
First Steps Monthly Expenditures/Direct Services By SPOE (FY12) July 2011 August 2011 September 2011 October 2011 November 2011 December 2011 Average Average Average Average Average Average Child Cost per Child Cost per Child Cost per Child Cost per Child Cost per Child Cost per SPOE Name Expenditures Count Child Expenditures Count Child Expenditures Count Child Expenditures Count Child Expenditures Count Child Expenditures Count Child St. Louis $241,625.60 624 $387.22 $261,858.89 625 $418.97 $235,549.46 610 $386.15 $234,433.00 610 $384.32 $234,658.94 573 $409.53 $322,371.04 626 $514.97 St. Louis County $284,343.30 686 $414.49 $292,014.08 715 $408.41 $291,311.61 697 $417.95 $294,611.90 704 $418.48 $276,598.20 711 $389.03 $389,100.10 747 $520.88 Northeast $90,242.55 232 $388.98 $93,085.40 231 $402.97 $84,039.34 247 $340.24 $70,062.53 204 $343.44 $83,748.70 215 $389.53 $105,652.90 250 $422.61 Northwest $227,834.60 442 $515.46 $247,877.21 489 $506.91 $199,733.60 471 $424.06 $223,302.34 437 $510.99 $192,123.48 444 $432.71 $261,135.82 484 $539.54 Kansas City $443,669.76 877 $505.89 $418,903.00 869 $482.05 $401,439.41 880 $456.18 $405,264.42 816 $496.65 $388,934.04 793 $490.46 $517,607.35 871 $594.27 Central $207,671.54 423 $490.95 $186,375.50 427 $436.48 $162,778.40 414 $393.18 $142,610.92 367 $388.59 $134,130.05 361 $371.55 $242,909.46 452 $537.41 Southwest $111,182.00 262 $424.36 $100,997.50 267 $378.27 $101,396.50 270 $375.54 $116,985.15 264 $443.13 $95,452.95 285 $334.92 $142,242.45 313 $454.45 South Central $153,677.26 467 $329.07 $139,307.72 466 $298.94 $152,646.13 476 $320.69 $132,691.80 445 $298.18 $143,202.51 441 $324.72 $176,174.59 489 $360.28 East Central $186,672.54 519 $359.68 $193,083.05 525 $367.78 $173,480.05 466 $372.27 $173,793.05 468 $371.35 $154,296.99 474 $325.52 $242,255.71 536 $451.97 Southeast $145,203.20 344 $422.10 $134,346.70 348 $386.05 $120,899.78 354 $341.52 $116,949.04 316 $370.09 $116,090.74 306 $379.38 $154,181.27 336 $458.87 Monthly Total $2,092,122.35 4876 $429.07 $2,067,849.05 4962 $416.74 $1,923,274.28 4885 $393.71 $1,910,704.15 4631 $412.59 $1,819,236.60 4603 $395.23 $2,553,630.69 5104 $500.32 January 2012 February 2012 March 2012 April 2012 May 2012 June 2012 Average Average Average Average Average Average Child Cost per Child Cost per Child Cost per Child Cost per Child Cost per Child Cost per SPOE Name Expenditures Count Child Expenditures Count Child Expenditures Count Child Expenditures Count Child Expenditures Count Child Expenditures Count Child St. Louis $196,001.43 582 $336.77 $248,253.63 640 $387.90 $209,509.19 605 $346.30 $223,485.72 597 $374.35 $325,967.45 675 $482.91 $223,381.92 610 $366.20 St. Louis County $255,820.38 689 $371.29 $263,808.00 724 $364.38 $266,069.56 731 $363.98 $254,434.31 735 $346.17 $430,788.64 835 $515.91 $286,045.28 772 $370.52 Northeast $73,085.03 235 $311.00 $80,090.95 236 $339.37 $81,832.25 252 $324.73 $69,323.57 251 $276.19 $110,375.28 296 $372.89 $93,661.35 290 $322.97 Northwest $170,024.77 416 $408.71 $205,429.00 442 $464.77 $178,337.10 466 $382.70 $168,394.53 460 $366.08 $244,671.26 485 $504.48 $188,580.51 490 $384.86 Kansas City $333,292.73 789 $422.42 $381,837.92 812 $470.24 $359,160.86 824 $435.87 $356,301.07 794 $448.74 $510,349.72 848 $601.83 $375,726.21 807 $465.58 Central $135,333.31 397 $340.89 $138,670.38 400 $346.68 $144,602.79 424 $341.04 $139,951.29 364 $384.48 $233,689.87 480 $486.85 $156,523.28 432 $362.32 Southwest $104,401.15 306 $341.18 $115,367.50 301 $383.28 $105,414.90 293 $359.78 $120,671.50 303 $398.26 $158,581.70 333 $476.22 $118,708.00 315 $376.85 South Central $125,241.45 450 $278.31 $155,406.11 467 $332.78 $149,523.25 468 $319.49 $150,977.00 481 $313.88 $184,225.85 502 $366.98 $165,778.91 512 $323.79 East Central $138,334.17 451 $306.73 $163,806.70 453 $361.60 $160,152.98 482 $332.27 $151,472.90 476 $318.22 $252,763.87 553 $457.08 $168,893.58 515 $327.95 Southeast $106,255.52 315 $337.32 $121,344.10 305 $397.85 $115,926.46 298 $389.01 $105,846.43 308 $343.66 $158,415.66 356 $444.99 $111,512.85 336 $331.88 Monthly Total $1,637,789.94 4630 $353.73 $1,874,014.29 4780 $392.05 $1,770,529.34 4843 $365.59 $1,740,858.32 4769 $365.04 $2,609,829.30 5363 $486.64 $1,888,811.89 5079 $371.89 Yearly Average Child Cost per SPOE Name Expenditures Count Child St. Louis $246,424.69 615 $399.63 St. Louis County $298,745.45 729 $408.46 Northeast $86,266.65 245 $352.91 Northwest $208,953.69 461 $453.44 Kansas City $407,707.21 832 $489.18 Central $168,770.57 412 $406.70 Southwest $115,950.11 293 $395.52 South Central $152,404.38 472 $322.26 East Central $179,917.13 493 $362.70 Southeast $125,580.98 327 $383.56 Total $1,990,720.85 4877 $406.88
