ERIC ED605628: Ohio [State Profile] PDF
Preview ERIC ED605628: Ohio [State Profile]
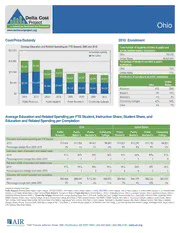
Ohio Cost/Price/Subsidy 2010 Enrollment Average Education and Related Spending per FTE Student, 2005 and 2010 Total number of students enrolled at public and $20,000 private postsecondary institutions Average subsidy Ohio 740,253 Net tuition United States 20,820,631 $15,000 Percentage of students enrolled in public institutions $5,388 $5,601 Ohio 72% $10,000 $3,916 United States 71% $3,996 Distribution of enrollment at public institutions $4,050 $4,395 $3,948 $3,617 United $5,000 $9,705 $10,236 $7,069 $7,644 Ohio States $5,138 $5,232 $4,982 $5,026 Research 47% 29% $0 Master's 3% 18% 2005 2010 2005 2010 2005 2010 2005 2010 Bachelor's 5% 3% Public Research Public Master's Public Bachelor's Community Colleges Community Colleges 42% 49% Other 4% 1% Average Education and Related Spending per FTE Student, Instruction Share, Student Share, and Education and Related Spending per Completion Ohio United States Public Public Public Community Public Public Public Community Research Master's Bachelor's College Research Master's Bachelor's College Education and related spending per FTE student 2010 $15,624 $11,560 $9,627 $8,643 $15,951 $12,240 $12,740 $9,501 Percentage change from 2005–2010 2% 4% 5% -3% 8% 6% 8% -2% Instruction share of education and related costs 2010 61% 56% 53% 54% 63% 52% 50% 51% Percentage-point change from 2005–2010 1 -1 -1 1 0 0 1 0 Net tuition share of education and related costs 2010 67% 66% 59% 60% 56% 53% 48% 36% Percentage-point change from 2005–2010 2 2 0 3 6 6 5 5 Education and related spending per completion 2010 $62,406 $66,447 $113,353 $58,925 $64,403 $54,378 $69,293 $45,057 Percentage change from 2005–2010 3% 11% 3% 11% 7% 4% 10% 0% Institutions included in the data: Public Research: Bowling Green State U.-Main Campus, Cleveland State U., Kent State U. Kent Campus, Miami U.-Oxford, Ohio State U.-Main Campus, Ohio U.-Main Campus, U. of Akron Main Campus, U. of Cincinnati-Main Campus, U. of Toledo, Wright State U.-Main Campus Public Master’s: Youngstown State U. Public Bachelor’s: Central State U., Ohio U.-Chillicothe Campus, Ohio U.-Lancaster Campus, Ohio U.-Southern Campus, Ohio U.- Zanesville Campus, Shawnee State U. Community Colleges: Belmont Tech. College, Bowling Green State U.-Firelands, Central Ohio Tech. College, Cincinnati State Tech., Clark State, Columbus State, Cuyahoga District, Eastern Gateway, Edison State, Hocking College, James A Rhodes State College, Kent State U. East Liverpool Campus, Kent State U. Salem Campus, Kent State U. Tuscarawas Campus, Lakeland, Lorain County, Marion Tech. College, North Central State College, Northwest State, Ohio State U.- Agricultural Tech. Institute, Ohio State U.-Lima Campus, Ohio State U.-Mansfield Campus, Ohio State U.-Marion Campus, Ohio State U.-Newark Campus, Owens, Sinclair, Southern State, Stark State College of Tech., Terra State, U. of Akron Wayne College, U. of Cincinnati-Clermont College, U. of Cincinnati-Raymond Walters College, Washington State, Wright State U.- Lake Campus, Zane State College 1000 Thomas Jefferson Street, NW | Washington, DC 2007-3835 | 202.403.5000 | 800.356.2735 | www.air.org Ohio Key metrics Education and related spending: Expenses most directly related to the educational mission of colleges and universities and includes spending on instruction, student services, and the education share of spending on academic support, institutional support, and operations and maintenance (i.e., “overhead”). Net tuition portion of education and related spending: Amount of tuition revenues an institution takes in from students (including fees) net of all institutional grant aid provided. Average subsidy portion of education and related spending: Difference between education and related spending and net tuition revenues; this is the average dollar amount of education and related spending that is covered by institutional resources (primarily state funding at public institutions). Instruction share of education and related spending: The percentage of education and related spending that is dedicated to instruction. Net tuition share of education and related spending: The percentage of education and related spending that is paid, on average, from net tuition revenues. Education and related spending per completion: Estimate of the total education and related spending per completion, calculated by summing the education and related costs for all students for a year, and dividing that by all degrees and certificates awarded in that year. Institutional groupings Public research. Includes public four-year institutions that award at least 20 doctoral degrees per year. Public master’s. Includes public four-year institutions that award at least 50 master’s degrees per year. Public bachelor’s. Includes public four-year institutions where baccalaureate degrees represent at least 10 percent of all undergraduate degrees and that award fewer than 50 master’s degrees or fewer than 20 doctoral degrees per year. Community colleges. Includes public two-year institutions where all degrees are at the associate’s level, or where bachelor’s degrees account for less than 10 percent of all undergraduate degrees. 1000 Thomas Jefferson Street, NW | Washington, DC 2007-3835 | 202.403.5000 | 800.356.2735 | www.air.org
