ERIC ED605626: New York [State Profile] PDF
Preview ERIC ED605626: New York [State Profile]
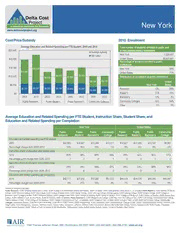
New York Cost/Price/Subsidy 2010 Enrollment Average Education and Related Spending per FTE Student, 2005 and 2010 Total number of students enrolled at public and $25,000 private postsecondary institutions Average subsidy New York 1,328,657 Net tuition $20,000 United States 20,820,631 Percentage of students enrolled in public institutions $15,000 $16,265 New York 54% $13,967 United States 71% $10,000 $6,606 $8,470 $7,639 $9,352 Distribution of enrollment at public institutions $6,284 $6,120 United $5,000 New York States $5,751 $6,297 $6,023 $6,198 $5,800 $5,892 Research 13% 29% $3,989 $4,280 $0 Master's 31% 18% 2005 2010 2005 2010 2005 2010 2005 2010 Bachelor's 10% 3% Public Research Public Master's Public Bachelor's Community Colleges Community Colleges 45% 49% Other 1% 1% Average Education and Related Spending per FTE Student, Instruction Share, Student Share, and Education and Related Spending per Completion New York United States Public Public Public Community Public Public Public Community Research Master's Bachelor's College Research Master's Bachelor's College Education and related spending per FTE student 2010 $22,562 $14,667 $15,244 $10,411 $15,951 $12,240 $12,740 $9,501 Percentage change from 2005–2010 14% 16% 13% 1% 8% 6% 8% -2% Instruction share of education and related costs 2010 60% 54% 48% 50% 63% 52% 50% 51% Percentage-point change from 2005–2010 1 -1 0 1 0 0 1 0 Net tuition share of education and related costs 2010 29% 43% 39% 42% 56% 53% 48% 36% Percentage-point change from 2005–2010 -3 -6 -4 2 6 6 5 5 Education and related spending per completion 2010 $88,711 $57,408 $72,928 $61,516 $64,403 $54,378 $69,293 $45,057 Percentage change from 2005–2010 8% 21% 10% 9% 7% 4% 10% 0% Institutions included in the data: Public Research: CUNY Graduate School and U.Center, SUNY College of Environmental Science and Forestry, SUNY at Albany, SUNY at Binghamton, Stony Brook U., U. at Buffalo Public Master’s: CUNY Bernard M Baruch College, CUNY Brooklyn College, CUNY City College, CUNY College of Staten Island, CUNY Hunter College, CUNY John Jay College Criminal Justice, CUNY Lehman College, CUNY Queens College, SUNY College at Brockport, SUNY College at Buffalo, SUNY College at Cortland, SUNY College at New Paltz, SUNY College at Oneonta, SUNY College at Oswego, SUNY College at Plattsburgh, SUNY College at Potsdam, SUNY Empire State College, SUNY Institute of Tech. at Utica-Rome, SUNY at Fredonia, SUNY at Geneseo Public Bachelor’s: CUNY Medgar Evers College, CUNY New York City College of Tec., CUNY York College, Farmingdale State College, Fashion Institute of Tech., SUNY College at Old Westbury, SUNY College of Agriculture and Tech. at Cobleskill, SUNY College of Tech. at Alfred, SUNY College of Tech. at Delhi, SUNY at Purchase College Community Colleges: Adirondack, Broome, CUNY Borough of Manhattan, CUNY Bronx, CUNY Hostos, CUNY Kingsborough, CUNY LaGuardia, CUNY Queensborough, Cayuga County, Clinton, Columbia-Greene, Corning, Dutchess, Erie, Finger Lakes, Fulton-Montgomery, Genesee, Herkimer County, Hudson Valley, Jamestown, Jefferson, Mohawk Valley-Utica Branch, Monroe, Morrisville State College, Nassau, Niagara County, North Country, Onondaga, Orange County, Rockland, SUNY College of Tech. at Canton, SUNY Westchester, Schenectady County, Suffolk County, Sullivan County, Tompkins Cortland, Ulster County 1000 Thomas Jefferson Street, NW | Washington, DC 2007-3835 | 202.403.5000 | 800.356.2735 | www.air.org New York Key metrics Education and related spending: Expenses most directly related to the educational mission of colleges and universities and includes spending on instruction, student services, and the education share of spending on academic support, institutional support, and operations and maintenance (i.e., “overhead”). Net tuition portion of education and related spending: Amount of tuition revenues an institution takes in from students (including fees) net of all institutional grant aid provided. Average subsidy portion of education and related spending: Difference between education and related spending and net tuition revenues; this is the average dollar amount of education and related spending that is covered by institutional resources (primarily state funding at public institutions). Instruction share of education and related spending: The percentage of education and related spending that is dedicated to instruction. Net tuition share of education and related spending: The percentage of education and related spending that is paid, on average, from net tuition revenues. Education and related spending per completion: Estimate of the total education and related spending per completion, calculated by summing the education and related costs for all students for a year, and dividing that by all degrees and certificates awarded in that year. Institutional groupings Public research. Includes public four-year institutions that award at least 20 doctoral degrees per year. Public master’s. Includes public four-year institutions that award at least 50 master’s degrees per year. Public bachelor’s. Includes public four-year institutions where baccalaureate degrees represent at least 10 percent of all undergraduate degrees and that award fewer than 50 master’s degrees or fewer than 20 doctoral degrees per year. Community colleges. Includes public two-year institutions where all degrees are at the associate’s level, or where bachelor’s degrees account for less than 10 percent of all undergraduate degrees. 1000 Thomas Jefferson Street, NW | Washington, DC 2007-3835 | 202.403.5000 | 800.356.2735 | www.air.org
