ERIC ED605620: New Jersey [State Profile] PDF
Preview ERIC ED605620: New Jersey [State Profile]
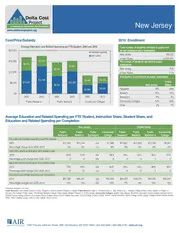
New Jersey Cost/Price/Subsidy 2010 Enrollment Average Education and Related Spending per FTE Student, 2005 and 2010 Total number of students enrolled at public and $20,000 private postsecondary institutions Average subsidy New Jersey 458,707 Net tuition United States 20,820,631 $15,000 $4,776 Percentage of students enrolled in public $6,215 institutions $4,891 $6,338 New Jersey 76% $10,000 United States 71% Distribution of enrollment at public institutions $12,746 $4,446 $3,136 $5,000 $10,647 $10,353 United $8,190 New Jersey States $3,988 $4,822 Research 16% 29% $0 Master's 26% 18% 2005 2010 2005 2010 2005 2010 Bachelor's 5% 3% Public Research Public Master's Community Colleges Community Colleges 51% 49% Other 2% 1% Average Education and Related Spending per FTE Student, Instruction Share, Student Share, and Education and Related Spending per Completion New Jersey United States Public Public Public Community Public Public Public Community Research Master's Bachelor's College Research Master's Bachelor's College Education and related spending per FTE student 2010 $17,522 $15,244 n/a $7,958 $15,951 $12,240 $12,740 $9,501 Percentage change from 2005–2010 4% 5% n/a -6% 8% 6% 8% -2% Instruction share of education and related costs 2010 64% 53% n/a 46% 63% 52% 50% 51% Percentage-point change from 2005–2010 2 4 n/a 0 0 0 1 0 Net tuition share of education and related costs 2010 74% 69% n/a 62% 56% 53% 48% 36% Percentage-point change from 2005–2010 10 12 n/a 14 6 6 5 5 Education and related spending per completion 2010 $67,144 $60,381 n/a $53,045 $64,403 $54,378 $69,293 $45,057 Percentage change from 2005–2010 10% 5% n/a -15% 7% 4% 10% 0% Institutions included in the data: Public Research: New Jersey Institute of Tech., Rutgers U.-New Brunswick, Rutgers U.-Newark Public Master’s: Kean U., Montclair State U., New Jersey City U., Ramapo College of New Jersey, Rowan U. Rutgers U.- Camden, The College of New Jersey, The Richard Stockton College of New Jersey, William Paterson U. of New Jersey] Community Colleges: Atlantic Cape, Bergen, Brookdale, Burlington County College, Camden County College, County College of Morris, Cumberland County College, Essex County College, Gloucester County College, Hudson County, Mercer County, Middlesex County College, Ocean County College, Passaic County, Raritan Valley, Salem, Sussex County, Union County College, Warren County 1000 Thomas Jefferson Street, NW | Washington, DC 2007-3835 | 202.403.5000 | 800.356.2735 | www.air.org New Jersey Key metrics Education and related spending: Expenses most directly related to the educational mission of colleges and universities and includes spending on instruction, student services, and the education share of spending on academic support, institutional support, and operations and maintenance (i.e., “overhead”). Net tuition portion of education and related spending: Amount of tuition revenues an institution takes in from students (including fees) net of all institutional grant aid provided. Average subsidy portion of education and related spending: Difference between education and related spending and net tuition revenues; this is the average dollar amount of education and related spending that is covered by institutional resources (primarily state funding at public institutions). Instruction share of education and related spending: The percentage of education and related spending that is dedicated to instruction. Net tuition share of education and related spending: The percentage of education and related spending that is paid, on average, from net tuition revenues. Education and related spending per completion: Estimate of the total education and related spending per completion, calculated by summing the education and related costs for all students for a year, and dividing that by all degrees and certificates awarded in that year. Institutional groupings Public research. Includes public four-year institutions that award at least 20 doctoral degrees per year. Public master’s. Includes public four-year institutions that award at least 50 master’s degrees per year. Public bachelor’s. Includes public four-year institutions where baccalaureate degrees represent at least 10 percent of all undergraduate degrees and that award fewer than 50 master’s degrees or fewer than 20 doctoral degrees per year. Community colleges. Includes public two-year institutions where all degrees are at the associate’s level, or where bachelor’s degrees account for less than 10 percent of all undergraduate degrees. 1000 Thomas Jefferson Street, NW | Washington, DC 2007-3835 | 202.403.5000 | 800.356.2735 | www.air.org
