ERIC ED544821: The Nation's Report Card Mathematics 2013 State Snapshot Report. Idaho. Grade 4, Public Schools PDF
Preview ERIC ED544821: The Nation's Report Card Mathematics 2013 State Snapshot Report. Idaho. Grade 4, Public Schools
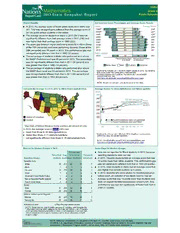
Idaho Mathematics Grade 4 2013 State Snapshot Report Public Schools Overall Results Achievement-Level Percentages and Average Score Results (cid:132) In 2013, the average score of fourth-grade students in Idaho was 241. This was not significantly different from the average score of 241 for public school students in the nation. (cid:132) The average score for students in Idaho in 2013 (241) was not significantly different from their average score in 2011 (240) and was higher than their average score in 1992 (222). (cid:132) The score gap between higher performing students in Idaho (those at the 75th percentile) and lower performing students (those at the 25th percentile) was 38 points in 2013. This performance gap was not significantly different from that in 1992 (37 points). (cid:132) The percentage of students in Idaho who performed at or above the NAEP Proficient level was 40 percent in 2013. This percentage was not significantly different from that in 2011 (39 percent) and was greater than that in 1992 (16 percent). (cid:132) The percentage of students in Idaho who performed at or above the NAEP Basic level was 83 percent in 2013. This percentage * Significantly different (p < .05) from state's results in 2013. Significance tests were performed using unrounded numbers. was not significantly different from that in 2011 (83 percent) and a Accommodations not permitted. For information about NAEP was greater than that in 1992 (63 percent). accommodations, see http://nces.ed.gov/nationsreportcard/about/inclusion.aspx. NOTE:Detail may not sum to totals because of rounding. Compare the Average Score in 2013 to Other States/Jurisdictions Average Scores for State/Jurisdiction and Nation (public) ¹Department of Defense Education Activity (overseas and domestic schools). In 2013, the average score in Idaho (241) was (cid:132) lower than those in 24 states/jurisdictions (cid:132) higher than those in 11 states/jurisdictions * Speigrnfoifrimcaendt lyu sdiniffge ruennrto (upn d<e .d0 5n)u fmrobme r2s0.13. Significance tests were (cid:132) not significantly different from those in 16 states/jurisdictions NOTE: For information about NAEP accommodations, see http://nces.ed.gov/nationsreportcard/about/inclusion.aspx. Results for Student Groups in 2013 Score Gaps for Student Groups Percentages (cid:132) Data are not reported for Black students in 2013, because Percent of Avg. at or above Percent at reporting standards were not met. Reporting Groups students score Basic Proficient Advanced (cid:132) In 2013, Hispanic students had an average score that was Race/Ethnicity 19 points lower than White students. This performance gap White 78 244 87 44 7 was not significantly different from that in 1992 (24 points). Black 1 ‡ ‡ ‡ ‡ (cid:132) In 2013, male students in Idaho had an average score that Hispanic 16 225 66 20 2 was higher than female students by 4 points. Asian 1 ‡ ‡ ‡ ‡ (cid:132) In 2013, students who were eligible for free/reduced-price American Indian/Alaska Native 1 ‡ ‡ ‡ ‡ school lunch, an indicator of low family income, had an Native Hawaiian/Pacific Islander # ‡ ‡ ‡ ‡ average score that was 15 points lower than students who Two or more races 2 ‡ ‡ ‡ ‡ were not eligible for free/reduced-price school lunch. This Gender performance gap was not significantly different from that in Male 51 243 84 44 8 2000 (17 points). Female 49 238 82 36 5 National School Lunch Program Eligible 50 233 76 29 3 Not eligible 50 248 90 51 10 # Rounds to zero. ‡ Reporting standards not met. NOTE: Detail may not sum to totals because of rounding, and because the "Information not available" category for the National School Lunch Program, which provides free/reduced-price lunches, is not displayed. Black includes African American and Hispanic includes Latino. Race categories exclude Hispanic origin. NOTE: Statistical comparisons are calculated on the basis of unrounded scale scores or percentages. SOURCE: U.S. Department of Education, Institute of Education Sciences, National Center for Education Statistics, National Assessment of Educational Progress (NAEP), various years, 1992–2013 Mathematics Assessments.
