ERIC ED532414: Apprentices & Trainees: Early Trend Estimates. March Quarter, 2012 PDF
Preview ERIC ED532414: Apprentices & Trainees: Early Trend Estimates. March Quarter, 2012
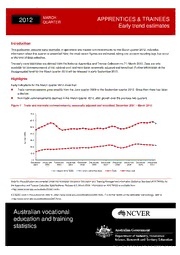
2 012 M A RCH APPRENTICES & TRAINEES QUARTER Early trend estimates Introduction This publication presents early estimates of apprentice and trainee commencements for the March quarter 2012. Indicative information about this quarter is presented here; the most recent figures are estimated, taking into account reporting lags that occur at the time of data collection. The early trend estimates are derived from the National Apprentice and Trainee Collection no.71, March 2012. Data are only available for commencements at the national level and have been seasonally adjusted and smoothed. Further information at the disaggregated level for the March quarter 2012 will be released in early September 2012. Highlights Early indications for the March quarter 2012 show that: Trade commencements grew steadily from the June quarter 2009 to the September quarter 2010. Since then there has been a decline. Non-trade commencements declined in the March quarter 2012, after growth over the previous two quarters. Figure 1 Trade and non-trade commencements, seasonally adjusted and smoothed, December 2001 – March 2012 70.0 60.0 50.0 00) 40.0 0 er (' mb 30.0 u N 20.0 10.0 0.0 December December December December December December December December December December December 2001 2002 2003 2004 2005 2006 2007 2008 2009 2010 2011 March 2012 Trade March 2012 Non-trade Trade Non-trade Data for this publication are compiled under the Australian Vocational Education and Training Management Information Statistical Standard (AVETMISS) for the Apprentice and Trainee Collection Specifications, Release 6.0, March 2008. Information on AVETMISS is available from <http://www.ncver.edu.au/avetmiss/21061.html>. For terms used in this publication, refer to <http://www.ncver.edu.au/publications/2490.html>. For further details on the estimates methodology, refer to <http://www.ncver.edu.au/publications/2267.html>. Australian vocational education and training statistics Table 1 Trade and non-trade commencements, seasonally adjusted and smoothed, December 2001 – March 2012 (’000) Trade Non-trade Total December 2001 12.9 46.1 58.9 March 2002 14.1 48.6 62.6 June 2002 15.4 50.6 66.1 September 2002 16.2 52.3 68.4 December 2002 16.4 54.9 71.1 March 2003 16.2 56.4 72.5 June 2003 16.2 55.4 71.7 September 2003 16.5 51.7 68.4 December 2003 16.9 47.5 64.6 March 2004 17.2 45.5 62.7 June 2004 17.5 46.0 63.5 September 2004 17.9 46.6 64.4 December 2004 18.1 47.4 65.5 March 2005 18.2 47.5 65.9 June 2005 18.3 47.2 65.7 September 2005 18.6 47.6 66.2 December 2005 18.9 48.2 67.0 March 2006 18.7 47.7 66.3 June 2006 18.6 47.0 65.6 September 2006 19.2 46.9 66.1 December 2006 19.9 47.5 67.4 March 2007 20.6 48.4 68.9 June 2007 21.0 48.1 68.9 September 2007 21.3 47.5 68.6 December 2007 22.1 48.3 70.3 March 2008 22.8 50.2 73.1 June 2008 22.5 51.4 74.0 September 2008 21.0 50.8 71.8 December 2008 19.3 48.8 67.9 March 2009 18.4 47.4 65.8 June 2009 18.9 47.5 66.3 September 2009 20.0 48.5 68.5 December 2009 21.6 50.0 71.6 March 2010 23.1 51.7 74.8 June 2010 24.3 53.8 77.9 September 2010 24.4 55.8 79.9 December 2010 23.8 56.9 80.4 March 2011 23.4 56.8 80.0 June 2011 23.2 56.6 79.7 September 2011 23.1 57.2 80.0 December 2011 22.8 58.0 80.3 March 2012(a) 22.3 55.6 78.1 Note: (a) The March quarter 2012 estimate is based on an early estimate which is seasonally adjusted (based on data from December 2001 to March 2012) and 7-point Henderson smoothed. Only the March quarter 2012 estimate from this series is presented. The quarterly data presented to December 2011 have been seasonally adjusted (based on data from December 2001 to December 2011) and 7-point Henderson smoothed. These are consistent with the forthcoming December quarterly 2011 publication. © Commonwealth of Australia, 2012 concerning other reproduction and rights should Comments and suggestions regarding this be directed to the National Centre for publication are welcomed and should be Vocational Education Research (NCVER). forwarded to NCVER. This document should be attributed as NCVER With the exception of the Commonwealth Coat 2012, Australian vocational education and training Published by NCVER of Arms, the Department’s logo, any material statistics: apprentices and trainees 2012 — early ABN 87 007 967 311 protected by a trade mark and where otherwise trend estimates, March quarter, NCVER, Level 11, 33 King William Street, noted all material presented in this document is Adelaide. Adelaide SA 5000 provided under a Creative Commons Attribution PO Box 8288, Station Arcade, This work has been produced by NCVER on 3.0 Australia Adelaide SA 5000, Australia behalf of the Australian Government and state <http://creativecommons.org/licenses/by/3.0/au> and territory governments, with funding Phone: (08) 8230 8400 licence. provided through the Department of Industry, Fax: (08) 8212 3436 The details of the relevant licence conditions Innovation, Science, Research and Tertiary Web: <http://www.ncver.edu.au> are available on the Creative Commons website Education. Email: <[email protected]> (accessible using the links provided) as is the The views and opinions expressed in this full legal code for the CC BY 3.0 AU licence document are those of NCVER and do not <http://creativecommons.org/licenses/by/3.0/leg necessarily reflect the views of the Australian alcode>. Government or state and territory governments. The Creative Commons licence conditions do ISSN 1838-0530 not apply to all logos, graphic design, artwork TD/TNC 108.05 and photographs. Requests and enquiries
