ERIC ED515428: The Nation's Report Card Science 2009 State Snapshot Report. New Mexico. Grade 8, Public Schools PDF
Preview ERIC ED515428: The Nation's Report Card Science 2009 State Snapshot Report. New Mexico. Grade 8, Public Schools
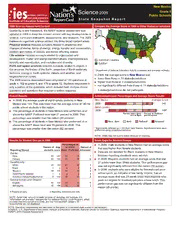
New Mexico Science Grade 8 2009 Public Schools Sta te Snapshot Report 2009 Science Assessment Content Compare the Average Score in 2009 to Other States/Jurisdictions Guided by a new framework, the NAEP science assessment was updated in 2009 to keep the content current with key developments in science, curriculum standards, assessments, and research. The 2009 framework organizes science content into three broad content areas. Physical science includes concepts related to properties and changes of matter, forms of energy, energy transfer and conservation, position and motion of objects, and forces affecting motion. Life science includes concepts related to organization and development, matter and energy transformations, interdependence, heredity and reproduction, and evolution and diversity. Earth and space sciences includes concepts related to objects in the universe, the history of the Earth, properties of Earth materials, ¹ Department of Defense Education Activity (overseas and domestic schools). tectonics, energy in Earth systems, climate and weather, and In 2009, the average score in New Mexico was biogeochemical cycles. � lower than those in 31 states/jurisdictions The 2009 science assessment was composed of 143 questions at � higher than those in 4 states/jurisdictions grade 4, 162 at grade 8, and 179 at grade 12. Students responded to � not significantly different from those in 11 states/jurisdictions only a portion of the questions, which included both multiple-choice questions and questions that required a written response. � 5 states/jurisdictions did not participate Overall Results Achievement-Level Percentages and Average Score Results � In 2009, the average score of eighth-grade students in New Mexico was 143. This was lower than the average score of 149 for public school students in the nation. � The percentage of students in New Mexico who performed at or above the NAEP Proficient level was 21 percent in 2009. This percentage was smaller than the nation (29 percent). � The percentage of students in New Mexico who performed at or above the NAEP Basic level was 55 percent in 2009. This percentage was smaller than the nation (62 percent). * Significantly different (p < .05) from New Mexico. Significance tests were performed using unrounded numbers. NOTE: Detail may not sum to totals because of rounding. Results for Student Groups in 2009 Score Gaps for Student Groups Percentages at � In 2009, male students in New Mexico had an average score Percent of Avg. or above Percent at that was higher than female students. Reporting Groups students score Basic Proficient Advanced � Data are not reported for Black students in New Mexico, Gender because reporting standards were not met. Male 50 147 60 24 1 Female 50 140 50 18 # � In 2009, Hispanic students had an average score that was Race/Ethnicity 27 points lower than White students. This performance gap White 29 163 81 39 2 was not significantly different from the nation (30 points). Black 3 ‡ ‡ ‡ ‡ � In 2009, students who were eligible for free/reduced-price Hispanic 58 135 44 14 # school lunch, an indicator of low family income, had an Asian/Pacific Islander 1 ‡ ‡ ‡ ‡ American Indian/Alaska Native 9 130 36 10 # average score that was 24 points lower than students who National School Lunch Program were not eligible for free/reduced-price school lunch. This Eligible 63 134 43 13 # performance gap was not significantly different from the Not eligible 35 158 75 35 2 nation (28 points). # Rounds to zero. ‡ Reporting standards not met. NOTE: Detail may not sum to totals because of rounding, and because the "Information not available" category for the National School Lunch Program, which provides free/reduced-price lunches, and the "Unclassified" category for race/ethnicity are not displayed. NOTE: Statistical comparisons are calculated on the basis of unrounded scale scores or percentages. SOURCE: U.S. Department of Education, Institute of Education Sciences, National Center for Education Statistics, National Assessment of Educational Progress (NAEP), 2009 Science Assessment.
