Differential Equations - Sinusoidal Functions PDF
Preview Differential Equations - Sinusoidal Functions
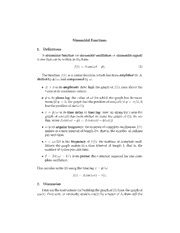
Sinusoidal Functions 1. Definitions A sinusoidal function (or sinusoidal oscillation or sinusoidal signal) is one that can be wrtten in the form f (t) = A cos(ωt − φ). (1) The function f (t) is a cosine function which has been amplified by A, shifted by φ/ω, and compressed by ω. • A > 0 is its amplitude: how high the graph of f (t) rises above the t-axis at its maximum values; • φ is its phase lag: the value of ωt for which the graph has its maxi mum (if φ = 0, the graph has the position of cos(ωt); if φ = π/2, it has the position of sin(ωt)); • τ = φ/ω is its time delay or time lag: how far along the t-axis the graph of cos(ωt) has been shifted to make the graph of (1); (to see this, write A cos(ωt − φ) = A cos(ω(t − φ/ω))) • ω is its angular frequency: the number of complete oscillations f (t) makes in a time interval of length 2π; that is, the number of radians per unit time; • ν = ω/2π is the frequency of f (t): the number of complete oscil lations the graph makes in a time interval of length 1; that is, the number of cycles per unit time; • P = 2π/ω = 1/ν is its period, the t-interval required for one com plete oscillation. One can also write (1) using the time lag τ = φ/ω f (t) = A cos (ω(t − τ)) . 2. Discussion Here are the instructions for building the graph of (1) from the graph of cos(t). First scale, or vertically stretch, cos(t) by a factor of A; then shift the Sinusoidal Functions OCW 18.03SC result to the right by φ units (if φ < 0 the shift will actually be to the left); and finally scale it horizontally by a factor of 1/ω. In the figure below the dotted curve is cos(t) and the solid curve is 2.5 cos(πt − π/2). The solid curve has A = 2.5, ω = π, φ = π/2, τ = 1/2. Vertically, the solid curve is 2.5 times the dotted one. Horizontally, the solid curve it 1/π times the dotted one. (The dotted curve takes 2π units of time to go through one cycle and the solid curve takes only 2 units of time.) The solid curve hits its first maximum at t = 1/2, i.e. at the t = τ, the time lag. amplitude = 2.5 2 1 t -3 -2 -1 1 2 3 4 5 6 7 -1 -2 time lag τ =1/2 one period = 2 one period = 2π Fig. 1. Features of the graph of a sinusoid. 2 MIT OpenCourseWare http://ocw.mit.edu 18.03SC Differential Equations�� Fall 2011 �� For information about citing these materials or our Terms of Use, visit: http://ocw.mit.edu/terms.
