Board Budget Ridership Presentation May 2009 PDF
Preview Board Budget Ridership Presentation May 2009
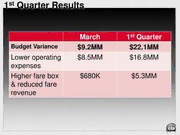
1st Quarter Results March 1st Quarter Budget Variance $9.2MM $22.1MM Lower operating $8.5MM $16.8MM expenses Higher fare box $680K $5.3MM & reduced fare revenue Cash Position March 2009 Dec 2008 March 2008 Working $69.0MM $38.2MM $71.2MM cash Damage $1.3MM $5.9MM $115.2MM reserve Total $70.3MM $44.1MM $186.4MM • $26.2MM improvement from 2008 year-end • $116.1MM decrease from prior year March Ridership 2.1MM Increase Over Budget 2.4 MM Rise in Bus Rides -0.3 MM Increase in Rail Rides 2.1MM Increase Over Prior Year 1.3 MM Increase in Bus Rides 1.3 MM Increase in Rail Rides 4.6 % Per Day Increase in Avg. Daily Rides 2009 Budget Report May 13, 2009 March Revenues System Generated Revenues: Variance to Budget Fare Box $ 21.83 M .05 Passes $ 18.01 M 1.14 Farebox Total $ 39.84 M 1.19 s n Non-Farebox $ 3.15 M 1.85 o i l l i M n Half-Fare Subsidy $ 1.35 M 1.35 i s r a l l o D 0.68 Total Revenue $ 44.34 Avg. Fare $0.90 Year-To-Date Revenues System Generated Revenues: Variance to Budget 1.99 Fare Box $ 63.54 M Passes $ 56.87 M 7.49 Farebox Total $ 120.42 M 5.50 s n Non-Farebox $ 9.24 M 5.67 o i l l i M n Half-Fare Subsidy $ 5.42 M 5.42 i s r a l l o D 5.25 Total Revenue $ 135.25 Avg. Fare $0.97 March Expenses March Expenses March expenses of $ 105.5 million were $8.5 Mil. favorable to the 2009 Budget Other 16.82 Fuel 7.5 7.55 Material 73.65 Labor Dollars in Millions
