Arrhythmia Classification in Multi-Channel ECG Signals Using Deep Neural Networks PDF
Preview Arrhythmia Classification in Multi-Channel ECG Signals Using Deep Neural Networks
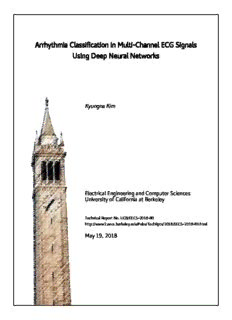
Arrhythmia Classification in Multi-Channel ECG Signals Using Deep Neural Networks Kyungna Kim Electrical Engineering and Computer Sciences University of California at Berkeley Technical Report No. UCB/EECS-2018-80 http://www2.eecs.berkeley.edu/Pubs/TechRpts/2018/EECS-2018-80.html May 19, 2018 Copyright © 2018, by the author(s). All rights reserved. Permission to make digital or hard copies of all or part of this work for personal or classroom use is granted without fee provided that copies are not made or distributed for profit or commercial advantage and that copies bear this notice and the full citation on the first page. To copy otherwise, to republish, to post on servers or to redistribute to lists, requires prior specific permission. Arrhythmia Classification in Multi-Channel ECG Signals Using Deep Neural Networks Copyright 2018 by Kyungna Kim 1 Abstract An important diagnostic tool in identifying heart rhythm irregularities, known as arrhyth- mias, is the electrocardiogram (ECG). Accurate identification of arrhythmias is critical to patient well-being in clinical settings, as both acute and chronic heart conditions are typ- ically reflected in these readings. This is known to be a difficult problem even for human experts, due to variability between individuals and inevitable noise. We explore the use of deep neural networks for the task of classifying ECG recordings using recurrent and residual architectures. Using a dataset of 106 patient readings, we train several deep networks to categorize slices of ECG data into one of six classes, including normal sinus rhythm, arti- fact/noise, and four arrhythmias of varying levels of severity. We investigate the usefulness of multi-channel ECG data without additional feature extraction in this problem, especially when common frequency domain transformation feature representation may not be suitable due to low periodicity of data. i Contents Contents i List of Figures ii List of Tables iii 1 Introduction 1 2 Background 3 2.1 Cardiac Arrhythmias . . . . . . . . . . . . . . . . . . . . . . . . . . . . . . . 3 2.2 Related Work . . . . . . . . . . . . . . . . . . . . . . . . . . . . . . . . . . . 5 3 Methods 7 3.1 Data . . . . . . . . . . . . . . . . . . . . . . . . . . . . . . . . . . . . . . . . 7 3.2 Model Architectures . . . . . . . . . . . . . . . . . . . . . . . . . . . . . . . 8 3.3 Metrics . . . . . . . . . . . . . . . . . . . . . . . . . . . . . . . . . . . . . . . 12 4 Experiments and Results 14 4.1 Setup . . . . . . . . . . . . . . . . . . . . . . . . . . . . . . . . . . . . . . . . 14 4.2 Training . . . . . . . . . . . . . . . . . . . . . . . . . . . . . . . . . . . . . . 15 4.3 Results . . . . . . . . . . . . . . . . . . . . . . . . . . . . . . . . . . . . . . . 15 5 Conclusions and Future Work 19 5.1 Limitations . . . . . . . . . . . . . . . . . . . . . . . . . . . . . . . . . . . . 19 5.2 Future Work . . . . . . . . . . . . . . . . . . . . . . . . . . . . . . . . . . . . 21 References 22 ii List of Figures 2.1 Examples of rhythm types . . . . . . . . . . . . . . . . . . . . . . . . . . . . . . 4 2.2 Single vs multi-channel data . . . . . . . . . . . . . . . . . . . . . . . . . . . . . 5 3.1 An LSTM unit . . . . . . . . . . . . . . . . . . . . . . . . . . . . . . . . . . . . 9 3.2 Bidirectional LSTM network with 2 stacked layers . . . . . . . . . . . . . . . . . 10 3.3 Residual network . . . . . . . . . . . . . . . . . . . . . . . . . . . . . . . . . . . 11 3.4 Combined LSTM-CNN model (LSTM portion may be uni- or bidirectional) . . . 12 4.1 Scaled confusion matrices . . . . . . . . . . . . . . . . . . . . . . . . . . . . . . 17 4.2 Residual network accuracy and loss curves . . . . . . . . . . . . . . . . . . . . . 17 4.3 BDLSTM-CNN accuracy and loss curves . . . . . . . . . . . . . . . . . . . . . . 18 5.1 Mislabeled data . . . . . . . . . . . . . . . . . . . . . . . . . . . . . . . . . . . . 20 iii List of Tables 3.1 ECG dataset profile . . . . . . . . . . . . . . . . . . . . . . . . . . . . . . . . . 8 4.1 Aggregate accuracy for all classes (multi-channel) . . . . . . . . . . . . . . . . . 15 4.2 F1 score comparison over classes . . . . . . . . . . . . . . . . . . . . . . . . . . 16 4.3 Recall, precision, specificity, F1 score comparison over classes . . . . . . . . . . . 16 4.4 F1 score for single-channel versus multi-channel data . . . . . . . . . . . . . . . 16 iv Acknowledgments I thank my advisor, Professor Russell, for his expertise and guidance during my years at UC Berkeley. I also thank Professor Canny for being second reader. This would not have been possible without the help of my mentors; many thanks to Paria Rashidinejad, my closest collaborator, for her advice and support over the duration of my graduate career. I also thank Yusuf Bugra Erol for initially introducing me to medical applications of machine learning when I was an undergraduate, and the subsequent projects that led to this study. Lastly, I thank my friends and family for their unending encouragement and support. 1 Chapter 1 Introduction An important diagnostic tool in identifying chronic and acute heart rhythm irregularities (cardiac arrhythmias) is the electrocardiogram (ECG), which measures electrical heart ac- tivity via electrodes placed on a patient’s skin. ECGs are ubiquitous in intensive care units (ICUs), where clinicians must be able to make critical care decisions quickly and accurately. The ability to correctly distinguish various arrhythmias from each other is crucial for patient well-being; in many cases, the wave morphologies of benign and lethal arrhythmias can be difficult to distinguish. Existing monitoring systems for ECGs record a myriad of vital signs and also utilize algorithms to determine changes in cardiac rhythm. However, accurate identification of arrhythmias is known to be challenging even for medical professionals, and requires con- siderable medical expertise. A study investigating diagnostic accuracy for licensed general practitioners showed a specificity of 92% and sensitivity of only 80% in distinguishing atrial fibrillation from healthy sinus rhythms [1]. Waveforms often show variation given an indi- vidual’s unique biological characteristics, even for arrhythmias whose identifying patterns are known and well-documented. ECG recordings also suffer from several potential sources of considerable noise, including device power interference (as the measurements themselves are voltages), baseline drift, con- tact noise between the skin and the electrode, and motion artifacts. These motion artifacts, in particular, can be caused by any muscular activity from the patient; even innocuous move- ment can be mistakenly registered as arrhythmia. Many of our data points are classified as artifacts due to lead failure, excessive measurement noise, or even unclassifiable arrhythmia. The combination of inter-patient variability and noise makes this a challenging algo- rithmic classification problem, and a variety of methods have been proposed to increase diagnostic accuracy. Standard regression and feed-forward neural network models have been explored in the past, and more recent approaches also utilize deep CNN or RNN structures. Feature engineering and spectral analysis are also popular methods for adding or replacing features, though this often limits the scope of the classification. To exploit the inherently time-dependent nature of ECG readings, we investigate the use of LSTM networks, commonly used to classify or generate sequential data, to distinguish
Description:The list of books you might like

The 5 Second Rule: Transform your Life, Work, and Confidence with Everyday Courage

The Silent Patient

Rich Dad Poor Dad

Believe Me

Demographic & economic information for Cascade County

Intracranial Pressure VIII

Linda Lee Incorporated by Louis Joseph Vance

TCPS 1275-2549: Piccolo
CARA: Chicano Arts: Resistance and Affirmation Papers,

Una moneta chiamata fiducia

8 Habits of The Happy Millionaire

C anton €>fa^erner 1

Visiting Edna and Good for Otto

Ojo por ojo
The House of the Secret by Claude Farrre
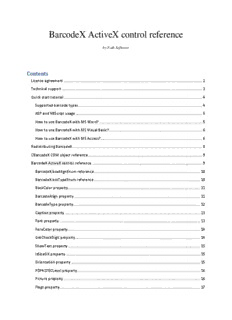
BarcodeX ActiveX control reference
DreamSongs for the Belovd by Eleanor Farjeon
cador ti on arco

Insight Guides Russia

