ANOVA - faculty.weber.edu PDF
Preview ANOVA - faculty.weber.edu
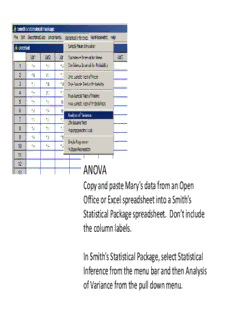
ANOVA Copy and paste Mary’s data from an Open Office or Excel spreadsheet into a Smith’s Statistical Package spreadsheet. Don’t include the column labels. In Smith’s Statistical Package, select Statistical Inference from the menu bar and then Analysis of Variance from the pull down menu. Check the Var boxes for the columns with the data to be analyzed. Click Okay. You will get a dialog box to confirm the data cells that you selected. Click Okay. You’ll get a box containing the results of the ANOVA, including the mean and standard deviation for each data group. The box with key information indicated is shown in the next slide. standard mean deviation 0% X 10% X 20% X 30% X p value of the ANOVA T Test Copy and paste Mary’s data from an Open Office or Excel spreadsheet into a Smith’s Statistical Package spreadsheet. Don’t include the column labels. In Smith’s Statistical Package, select Statistical Inference from the menu bar and then Two-Sample Test of Means from the pull down menu. If you want to enter the means and standard deviations from the ANOVA results, select the first option. Click Okay. You’ll get a dialog box with six boxes. Type the requested values into the boxes. Then click Okay. If you’d rather not type a lot of numbers, select the second option. Click Okay. You’ll get a dialog box where you can just check the columns for the two sets of data that you want to compare.
Description: