2021 Ridership Summary PDF
Preview 2021 Ridership Summary
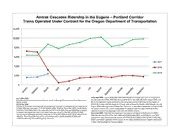
Amtrak Cascades Ridership in the Eugene – Portland Corridor Trains Operated Under Contract for the Oregon Department of Transportation 12,000 10,000 8,000 6,000 2021 4,000 2020 2019 2,000 0 Jul to Sept 2020 ‐July to September 2020 ridership decreased year‐over‐year as compared to Jan to Mar 2021 Ridership continues to recover month over month, with a significant increase from February to the same period in 2019. Ridership decreased 83.8% for July 2020, 83.1% for August 2020, and March, at 42%. 80.7% for September 2020 compared to this same time period in 2019 due to the impacts of Oct to Dec 2020 COVID‐19. In May, ridership began to increase, and continued to steadily climb through July and October to December 2020 ridership decreased year‐over‐year as compared to the same period August 2020, with a decrease in September. Decreases in ridership in September are typical with in 2019. Ridership decreased 77.3% for October 2020, 79.8% for November 2020, and 82.4% for the end of summer. The service is anticipated to continue with the single roundtrip at 50% December 2020 compared to the same time period in 2019. Ridership was beginning to recover capacity to provide our passengers with safe and reliable services. in October and November until a two‐week freeze was issued to slow the spread of COVID, Apr to Jun 2020 ‐Ridership decreased year‐over‐year as compared to April and June 2019. followed by an additional two‐week restriction in December, both of which led to reductions in Ridership decreased 94.4% for April 2020 and 90.8% for May 2020, and 84.0% for June 2020 ridership. The reduced level of service will continue with a single roundtrip at 50% until compared to June 2019 due to the impacts of COVID‐19. As a result of this decline in ridership, conditions allow for increased frequency of service. ODOT and WSDOT agreed to reduce service to one daily roundtrip between Eugene and Seattle. In May, ridership began to increase slightly. Amtrak Cascades Ridership in the Eugene-Portland Corridor TRAINS OPERATED UNDER CONTRACT FOR THE OREGON DEPARTMENT OF TRANSPORTATION TRAIN JAN FEB MAR APR MAY JUN JUL AUG SEP OCT NOV DEC YEAR 500 671 781 1094 2546 506 0 508 2 0 Northward Trains 671 781 1094 2546 0 511 (M-F) 0 2 513 (S-S-H) 0 1 505 909 872 1253 3034 Southward Trains 909 872 1253 3034 All 1580 1653 2347 0 0 0 0 0 0 0 0 0 5580 TRAIN JAN FEB MAR APR MAY JUN JUL AUG SEP OCT NOV DEC YEAR 500 1357 1359 606 194 328 615 737 812 730 853 854 765 9210 506 832 871 297 2000 2 508 1557 1597 760 3914 Northward Trains 0 3746 3827 1663 194 328 615 737 812 730 853 854 765 15124 511 (M-F) 474 464 228 1166 2 513 (S-S-H) 445 438 131 1014 505 0 2535 2286 1172 237 460 833 871 920 851 1095 1099 966 13325 Southward Trains 3454 3188 1531 237 460 833 871 920 851 1095 1099 966 15505 All 7200 7015 3194 431 788 1448 1608 1732 1581 1948 1953 1731 30629 500 1,528 1,307 1,749 1,682 1,779 1,812 1,986 2,156 1,656 1,817 1,418 1,780 20,670 506 441 645 978 731 840 1,070 974 1,089 929 823 1,571 1,231 11,322 2 508 1,329 1,435 1,981 1,814 2,015 1,930 2,153 2,182 1,718 2,099 2,261 2,233 23,150 Northward Trains 0 3,298 3,387 4,708 4,227 4,634 4,812 5,113 5,427 4,303 4,739 5,250 5,244 55,142 511 (M-F) 395 392 561 558 568 675 789 760 572 744 586 730 7,330 1 513 (S-S-H) 260 334 545 352 397 536 486 513 435 367 802 696 5,723 505 9 2,383 2,170 2,892 2,598 2,987 3,043 3,559 3,530 2,893 2,750 3,033 3,152 34,990 Southward Trains 3,038 2,896 3,998 3,508 3,952 4,254 4,834 4,803 3,900 3,861 4,421 4,578 48,043 All 6,336 6,283 8,706 7,735 8,586 9,066 9,947 10,230 8,203 8,600 9,671 9,822 103,185
