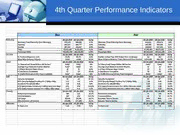
Table Of Content4th Quarter Performance Indicators
Bus Rail
Ridership 4th Qtr-2005 4th Qtr-2006 %Chg 4th Qtr-2005 4th Qtr-2006 %Chg
Weekday (Total Ridership Each Weekday) 978,143 980,582 0.2% Weekday (Total Ridership Each Weekday) 618,921 630,274 1.8%
Saturday 602,527 605,777 0.5% Saturday 342,090 354,529 3.6%
Sunday 397,051 400,627 0.9% Sunday 234,603 247,253 5.4%
Total 76,014,168 76,061,821 0.1% Total 47,300,301 48,272,202 2.1%
Passenger Miles 196,062,209 196,128,000 0.03% Passenger Miles 287,815,652 293,611,539 2.0%
On-Time 4th Qtr-2005 4th Qtr-2006 %Chg 4th Qtr-2005 4th Qtr-2006 %Chg
% Terminal Departure -1/+5 76.8% 80.3% 4.6% Number of Rail Trips With Delays Over 10 Minutes 312 267 -14.4%
Mean Miles Between Failures 4,064 6,350 56.3% Mean Distance Between Trains Removed From Service 2,074,366 445,736 -78.5%
Clean 4th Qtr-2005 4th Qtr-2006 %Chg 4th Qtr-2005 4th Qtr-2006 %Chg
% Cleaned and Swept Before AM Service* Daily* Daily* N/A % Cleaned and Swept Before AM Service Daily* Daily* N/A
Average Days Between Exterior Washes Daily* Daily* N/A Average Days Between Exterior Washes 12 14 16.6%
# of Days Between Major Cleans 18 18 0.0% # of Days Between Major Cleans 35 34 -2.9%
# Cleanliness Complaints 27 19 -29.6% # Cleanliness Complaints 39 35 -10.3%
% Graffiti Removed 24 Hrs. From Complaint Daily* Daily* N/A % Graffiti Removed 24 Hrs. From Complaint Daily* Daily* N/A
Safe 4th Qtr-2005 4th Qtr-2006 %Chg 4th Qtr-2005 4th Qtr-2006 %Chg
Security Complaints 28 44 57.1% Security Complaints 63 67 6.3%
NTD Security-Related Incident Per 1 Million Miles 1.57 1.47 -6.4% NTD Security-Related Incident Per 1 Million Miles 7.38 6.42 -13.0%
Accidents Per 100,000 Miles 6.50 6.55 0.8% Accidents Per 100,000 Miles 0.10 0.10 0.0%
NTD Safety-Related Incident Per 1 Million Miles-Non-Major 0.92 2.05 122.8% NTD Safety-Related Incident Per 1 Million Miles-Non-Major 1.89 1.60 -15.3%
NTD Safety-Related Incident Per 1 Million Miles-Major 0.32 0.32 0.0% NTD Safety-Related Incident Per 1 Million Miles-Major 0.02 0.15 650.0%
Friendly 4th Qtr-2005 4th Qtr-2006 %Chg 4th Qtr-2005 4th Qtr-2006 %Chg
Behavioral Complaints 496 415 -16.3% Behavioral Complaints 73 110 50.7%
Commendations 104 224 115.4% Commendations 31 52 67.7%
Lift Usage 28,639 24,146 -15.7% Escalator Time In Service 94% 95% 1.1%
Miles Between Lift Failures 104,096 177,050 70.1% Elevator Time In Service 97% 96% -1.0%
Affordable 4th Qtr-2005 4th Qtr-2006 %Chg 4th Qtr-2005 4th Qtr-2006 %Chg
% Days Lost 7.1% 7.9% 0.5% % Days Lost 7.7 7.9 2.6%
2005 Vs. 2006 Performance Indicators
Bus Rail
Ridership 2005 2006 %Chg 2005 2006 %Chg
Weekday (Total Ridership Each Weekday) 969,245 956,990 -1.3% Weekday (Total Ridership Each Weekday) 608,157 635,439 4.5%
Saturday 613,299 604,253 -1.5% Saturday 340,020 360,291 6.0%
Sunday 417,159 405,706 -2.7% Sunday 241,355 254,791 5.6%
Total 303,244,197 298,433,228 -1.6% Total 186,759,524 195,169,310 4.5%
Passenger Miles 781,977,754 769,574,914 -1.6% Passenger Miles 1,136,464,593 1,187,463,175 4.5%
On-Time 2005 2006 %Chg 2005 2006 %Chg
% Terminal Departure -1/+5 76.8% 80.6% 4.9% Number of Rail Trips With Delays Over 10 Minutes 1,726 1,493 -13.5%
Mean Miles Between Failures 3,995 4,867 21.8% Mean Distance Between Trains Removed From Service 816,871 326,845 -60.0%
Clean 2005 2006 %Chg 2005 2006 %Chg
% Cleaned and Swept Before AM Service* Daily* Daily* N/A % Cleaned and Swept Before AM Service Daily* Daily* N/A
Average Days Between Exterior Washes Daily* Daily* N/A Average Days Between Exterior Washes 11 10 -9.1%
# of Days Between Major Cleans 31 18 -41.9% # of Days Between Major Cleans* 24 33 37.5%
# Cleanliness Complaints 28 64 128.6% # Cleanliness Complaints 122 133 9.0%
% Graffiti Removed 24 Hrs. From Complaint Daily* Daily* N/A % Graffiti Removed 24 Hrs. From Complaint Daily* Daily* N/A
Safe 2005 2006 %Chg 2005 2006 %Chg
Security Complaints 93 130 39.8% Security Complaints 321 273 -15.0%
NTD Security-Related Incident Per 1 Million Miles 7.90 0.37 -95.3% NTD Security-Related Incident Per 1 Million Miles 44.46 1.94 -95.6%
Accidents Per 100,000 Miles 6.30 6.11 -3.0% Accidents Per 100,000 Miles 0.12 0.13 8.3%
NTD Safety-Related Incident Per 1 Million Miles-Non-Major 7.76 1.85 -76.2% NTD Safety-Related Incident Per 1 Million Miles-Non-Major 5.60 2.16 -61.4%
NTD Safety-Related Incident Per 1 Million Miles-Major 1.63 0.50 -69.3% NTD Safety-Related Incident Per 1 Million Miles-Major 0.31 0.12 -61.3%
Friendly 2005 2006 %Chg 2005 2006 %Chg
Behavioral Complaints 2,266 1,565 -30.9% Behavioral Complaints 321 359 11.8%
Commendations 547 594 8.6% Commendations 136 137 0.7%
Lift Usage 355,874 305,705 -14.1% Escalator Time In Service 95.4% 96% 0.6%
Miles Between Lift Failures 86,429 151,525 75.3% Elevator Time In Service 97.6% 96% -1.6%
Affordable 2005 2006 %Chg 2005 2006 %Chg
% Days Lost 7.7% 7.8% 0.5% % Days Lost 7.5% 7.7% 2.7%
*2005 number changed to reflect the removal of the mopping statistic.

